I was looking at your demonstration page showing an integration with home assistant:
http://ha.iammeter.com:18123/lovelace/Solar
Is there any chance of sharing the configuration for this page? Specifically the graphs, or what custom card you are using to generate them?

How to realize IamMeter meter photovoltaic statistics in homeassistant
1.WEM3080T wiring: CT1-->Inverter(yield_energy), CT2-->To Grid
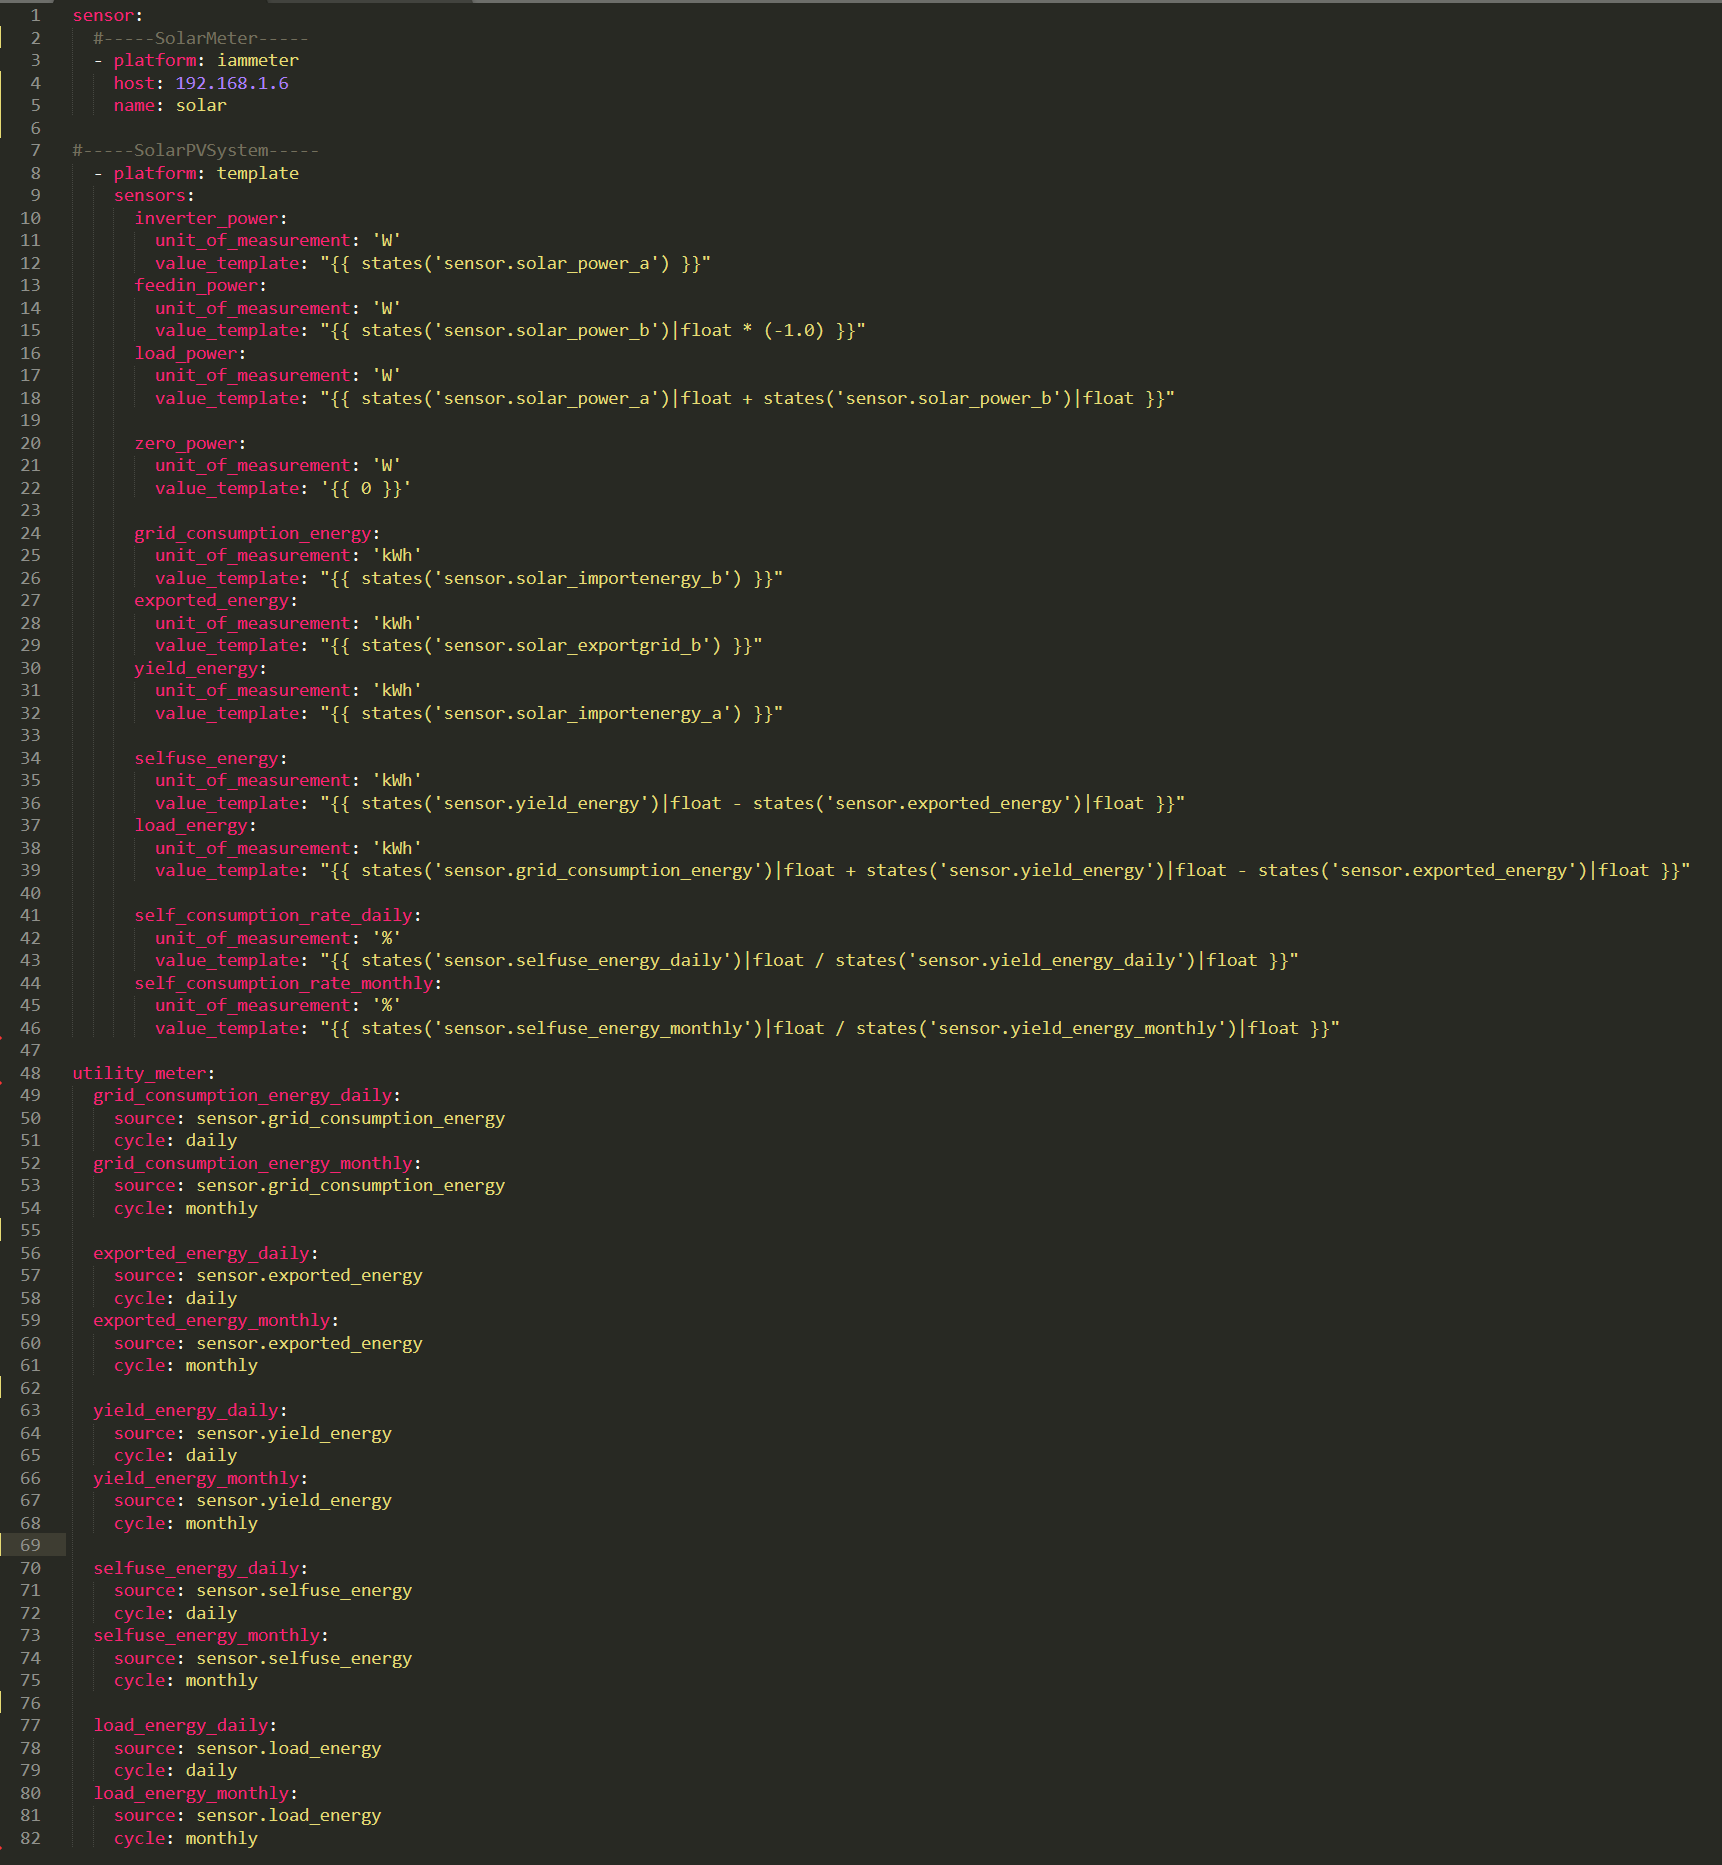
2.To use this sensor in your installation, add the following to your configuration.yaml file:
# Example configuration.yaml entry
sensor:
#-----SolarMeter-----
- platform: iammeter
host: 192.168.1.6
name: solar
#-----SolarPVSystem-----
- platform: template
sensors:
inverter_power:
unit_of_measurement: 'W'
value_template: "{{ states('sensor.solar_power_a') }}"
feedin_power:
unit_of_measurement: 'W'
value_template: "{{ states('sensor.solar_power_b')|float * (-1.0) }}"
load_power:
unit_of_measurement: 'W'
value_template: "{{ states('sensor.solar_power_a')|float + states('sensor.solar_power_b')|float }}"
zero_power:
unit_of_measurement: 'W'
value_template: '{{ 0 }}'
grid_consumption_energy:
unit_of_measurement: 'kWh'
value_template: "{{ states('sensor.solar_importenergy_b') }}"
exported_energy:
unit_of_measurement: 'kWh'
value_template: "{{ states('sensor.solar_exportgrid_b') }}"
yield_energy:
unit_of_measurement: 'kWh'
value_template: "{{ states('sensor.solar_importenergy_a') }}"
selfuse_energy:
unit_of_measurement: 'kWh'
value_template: "{{ states('sensor.yield_energy')|float - states('sensor.exported_energy')|float }}"
load_energy:
unit_of_measurement: 'kWh'
value_template: "{{ states('sensor.grid_consumption_energy')|float + states('sensor.yield_energy')|float - states('sensor.exported_energy')|float }}"
self_consumption_rate_daily:
unit_of_measurement: '%'
value_template: "{{ states('sensor.selfuse_energy_daily')|float / states('sensor.yield_energy_daily')|float }}"
self_consumption_rate_monthly:
unit_of_measurement: '%'
value_template: "{{ states('sensor.selfuse_energy_monthly')|float / states('sensor.yield_energy_monthly')|float }}"
utility_meter:
grid_consumption_energy_daily:
source: sensor.grid_consumption_energy
cycle: daily
grid_consumption_energy_monthly:
source: sensor.grid_consumption_energy
cycle: monthly
exported_energy_daily:
source: sensor.exported_energy
cycle: daily
exported_energy_monthly:
source: sensor.exported_energy
cycle: monthly
yield_energy_daily:
source: sensor.yield_energy
cycle: daily
yield_energy_monthly:
source: sensor.yield_energy
cycle: monthly
selfuse_energy_daily:
source: sensor.selfuse_energy
cycle: daily
selfuse_energy_monthly:
source: sensor.selfuse_energy
cycle: monthly
load_energy_daily:
source: sensor.load_energy
cycle: daily
load_energy_monthly:
source: sensor.load_energy
cycle: monthly
3.f you integrate HACS, you can install tesla-style-solar-power-card and apexcharts-card directly,
If you do not have HACS installed, you can manually install and load tesla-style-solar-power-card and apexcharts-card,
tesla-style-solar-power-card   apexcharts-card
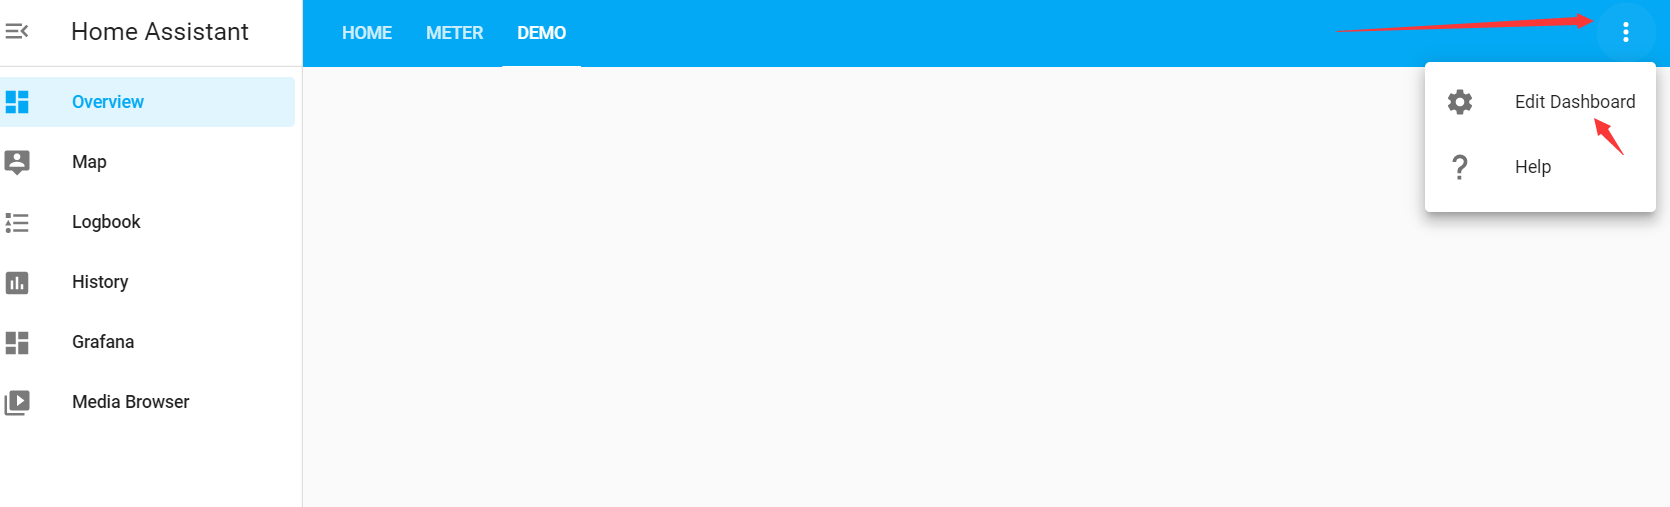
4.Add on the lovelace page:
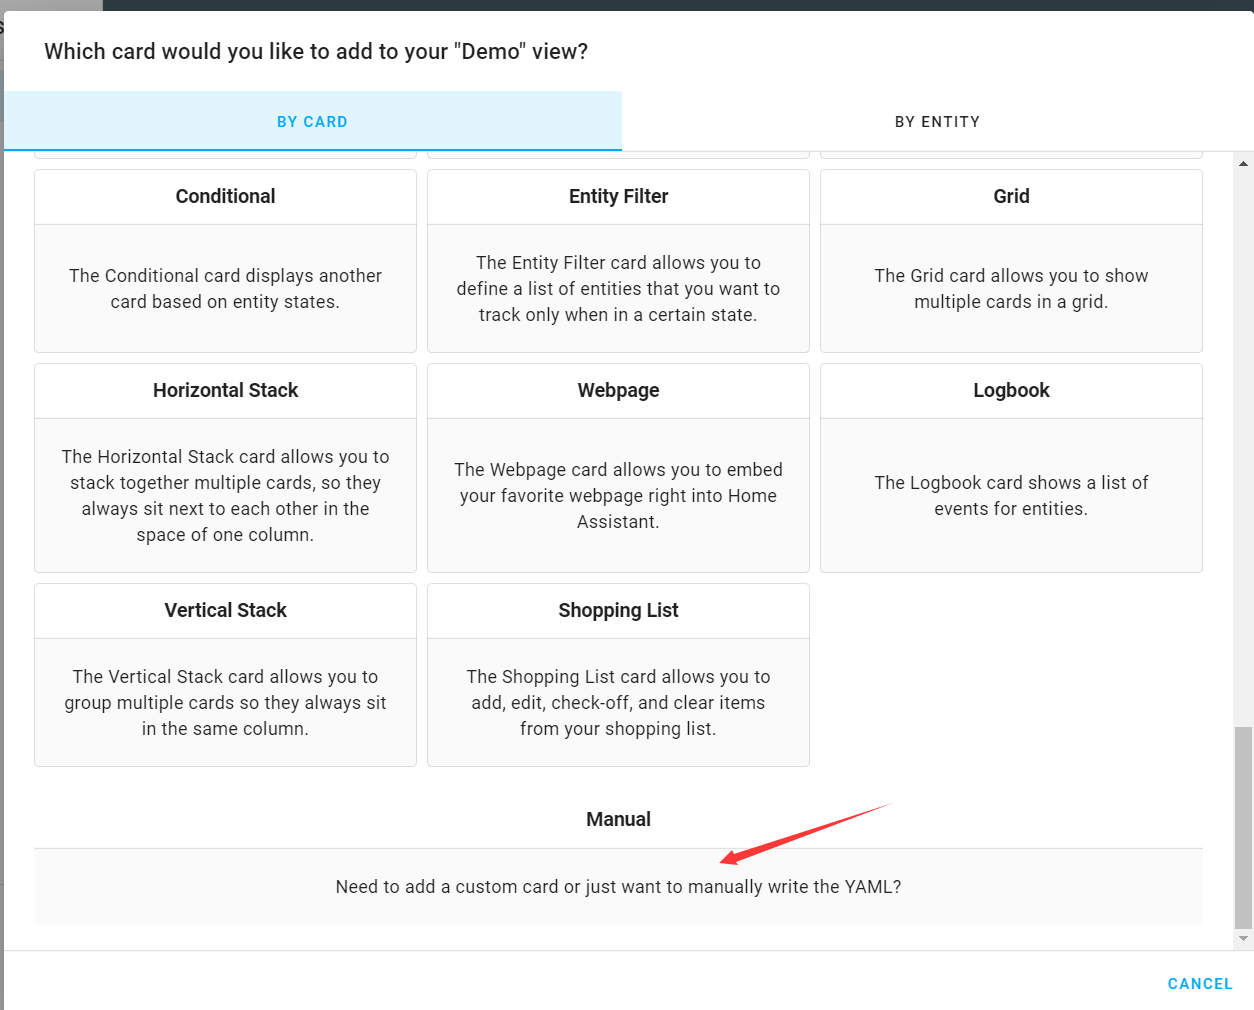
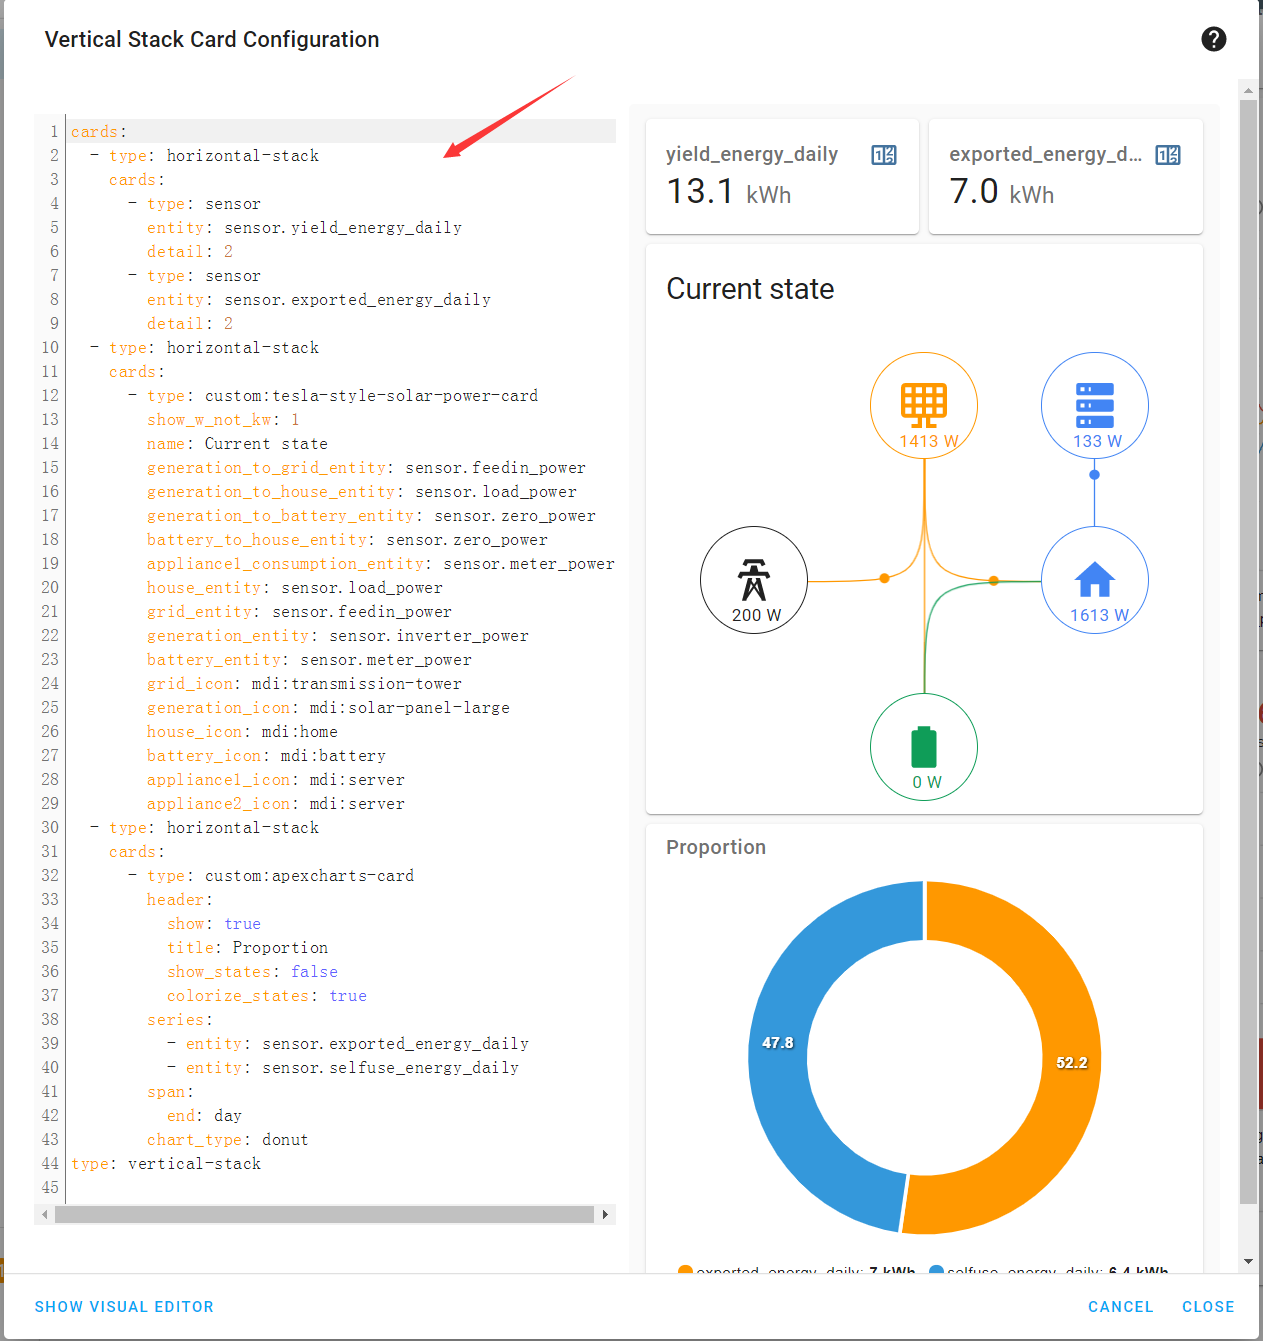
Copy and paste the following code 1:
cards:
- type: horizontal-stack
cards:
- type: sensor
entity: sensor.yield_energy_daily
detail: 2
- type: sensor
entity: sensor.exported_energy_daily
detail: 2
- type: horizontal-stack
cards:
- type: custom:tesla-style-solar-power-card
show_w_not_kw: 1
name: Current state
generation_to_grid_entity: sensor.feedin_power
generation_to_house_entity: sensor.load_power
generation_to_battery_entity: sensor.zero_power
battery_to_house_entity: sensor.zero_power
appliance1_consumption_entity: sensor.meter_power
house_entity: sensor.load_power
grid_entity: sensor.feedin_power
generation_entity: sensor.inverter_power
battery_entity: sensor.meter_power
grid_icon: mdi:transmission-tower
generation_icon: mdi:solar-panel-large
house_icon: mdi:home
battery_icon: mdi:battery
appliance1_icon: mdi:server
appliance2_icon: mdi:server
- type: horizontal-stack
cards:
- type: custom:apexcharts-card
header:
show: true
title: Proportion
show_states: false
colorize_states: true
series:
- entity: sensor.exported_energy_daily
- entity: sensor.selfuse_energy_daily
span:
end: day
chart_type: donut
type: vertical-stack
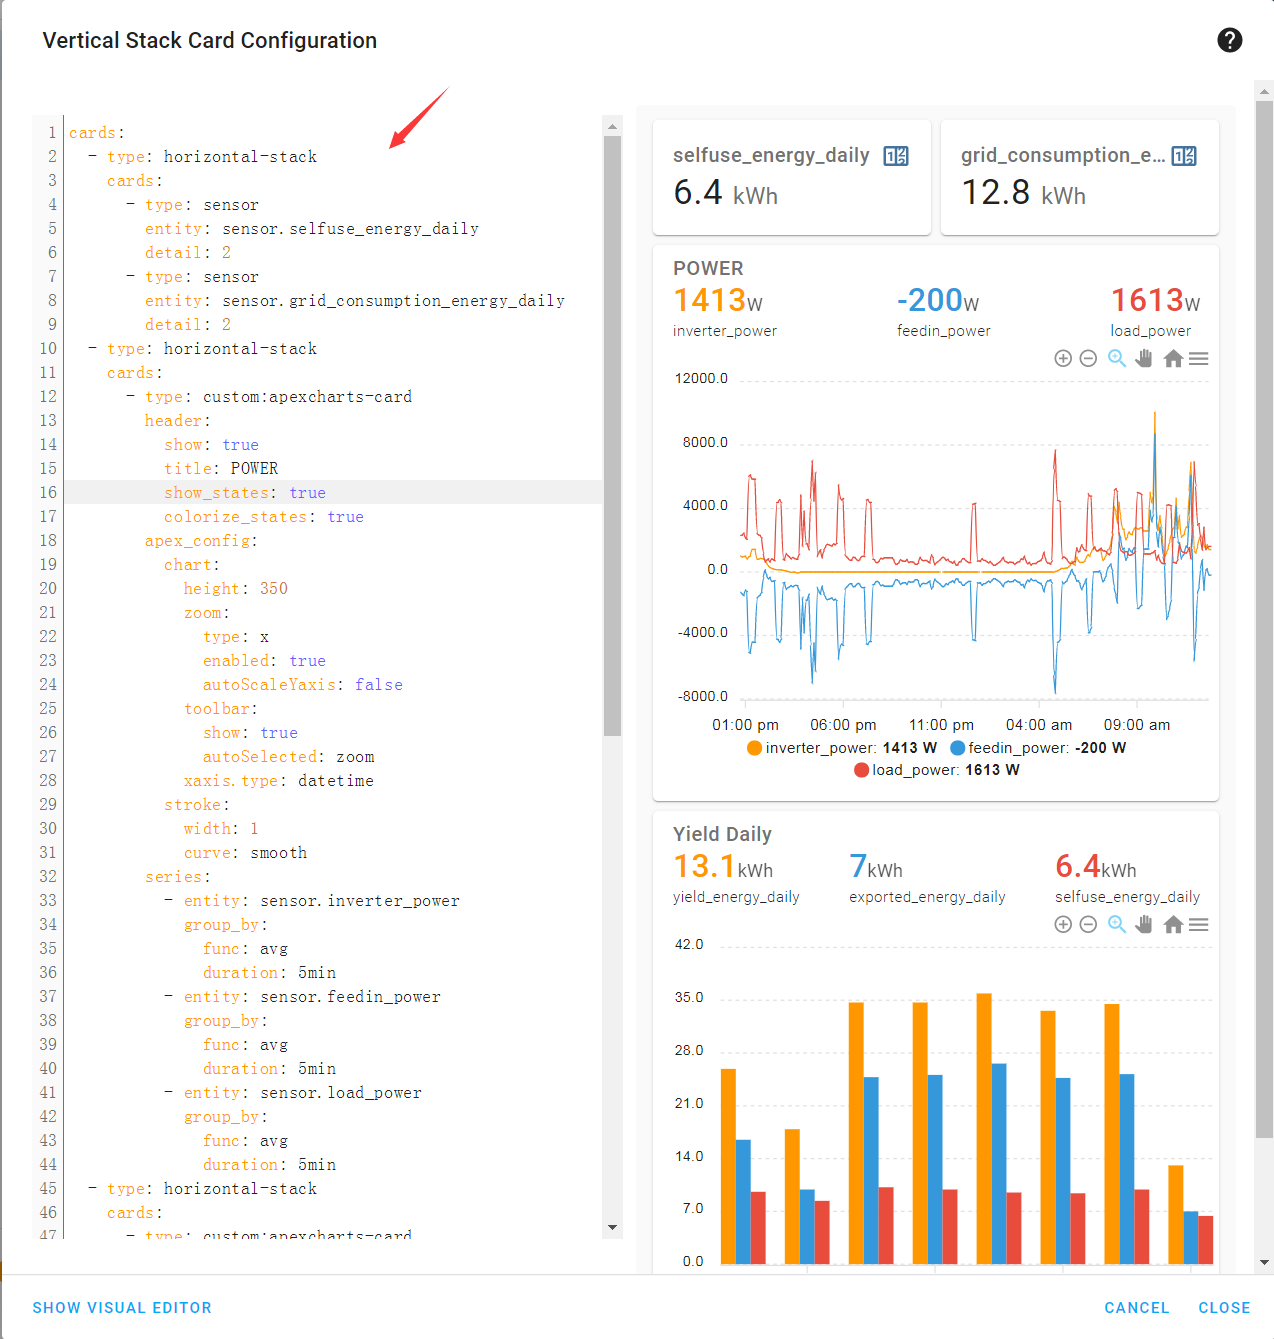
Copy and paste the following code 2:
cards:
- type: horizontal-stack
cards:
- type: sensor
entity: sensor.selfuse_energy_daily
detail: 2
- type: sensor
entity: sensor.grid_consumption_energy_daily
detail: 2
- type: horizontal-stack
cards:
- type: custom:apexcharts-card
header:
show: true
title: POWER
show_states: true
colorize_states: true
apex_config:
chart:
height: 350
zoom:
type: x
enabled: true
autoScaleYaxis: false
toolbar:
show: true
autoSelected: zoom
xaxis.type: datetime
stroke:
width: 1
curve: smooth
series:
- entity: sensor.inverter_power
group_by:
func: avg
duration: 5min
- entity: sensor.feedin_power
group_by:
func: avg
duration: 5min
- entity: sensor.load_power
group_by:
func: avg
duration: 5min
- type: horizontal-stack
cards:
- type: custom:apexcharts-card
header:
show: true
title: Yield Daily
show_states: true
colorize_states: true
apex_config:
chart:
height: 350
zoom:
type: x
enabled: true
autoScaleYaxis: false
toolbar:
show: true
autoSelected: zoom
xaxis.type: datetime
series:
- entity: sensor.yield_energy_daily
type: column
group_by:
func: max
duration: 24h
- entity: sensor.exported_energy_daily
type: column
group_by:
func: max
duration: 24h
- entity: sensor.selfuse_energy_daily
type: column
group_by:
func: max
duration: 24h
graph_span: 8d
span:
end: day
type: vertical-stack