
Hi,
I have a three phase system with grid and solar panels. I have attached a iammeter to the grid meter and another iammeter to the inverter. I get reading and have set up my cloud account.
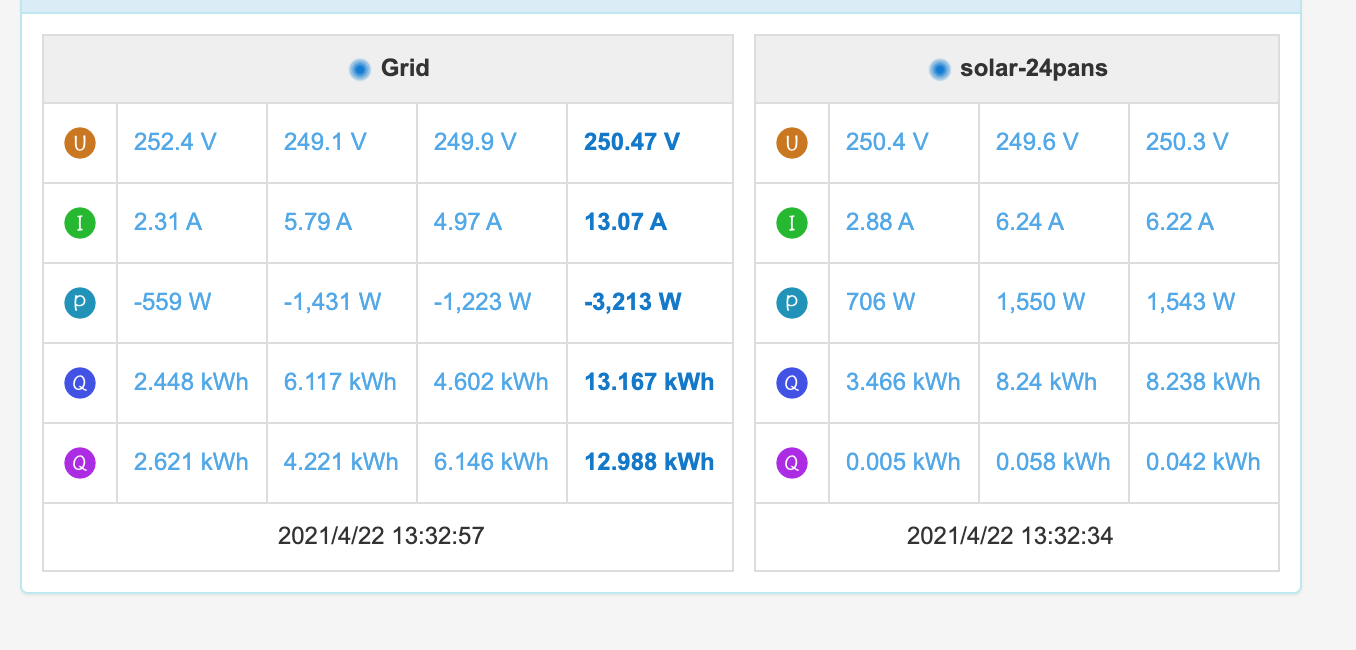
I believe I have the grid sensors in the correct orientation because I turned of the invertor and the power reading went postive. I understood that that a positive value for the power indicates power coming into my house from the grid and a negative value indicates power export to the grid.
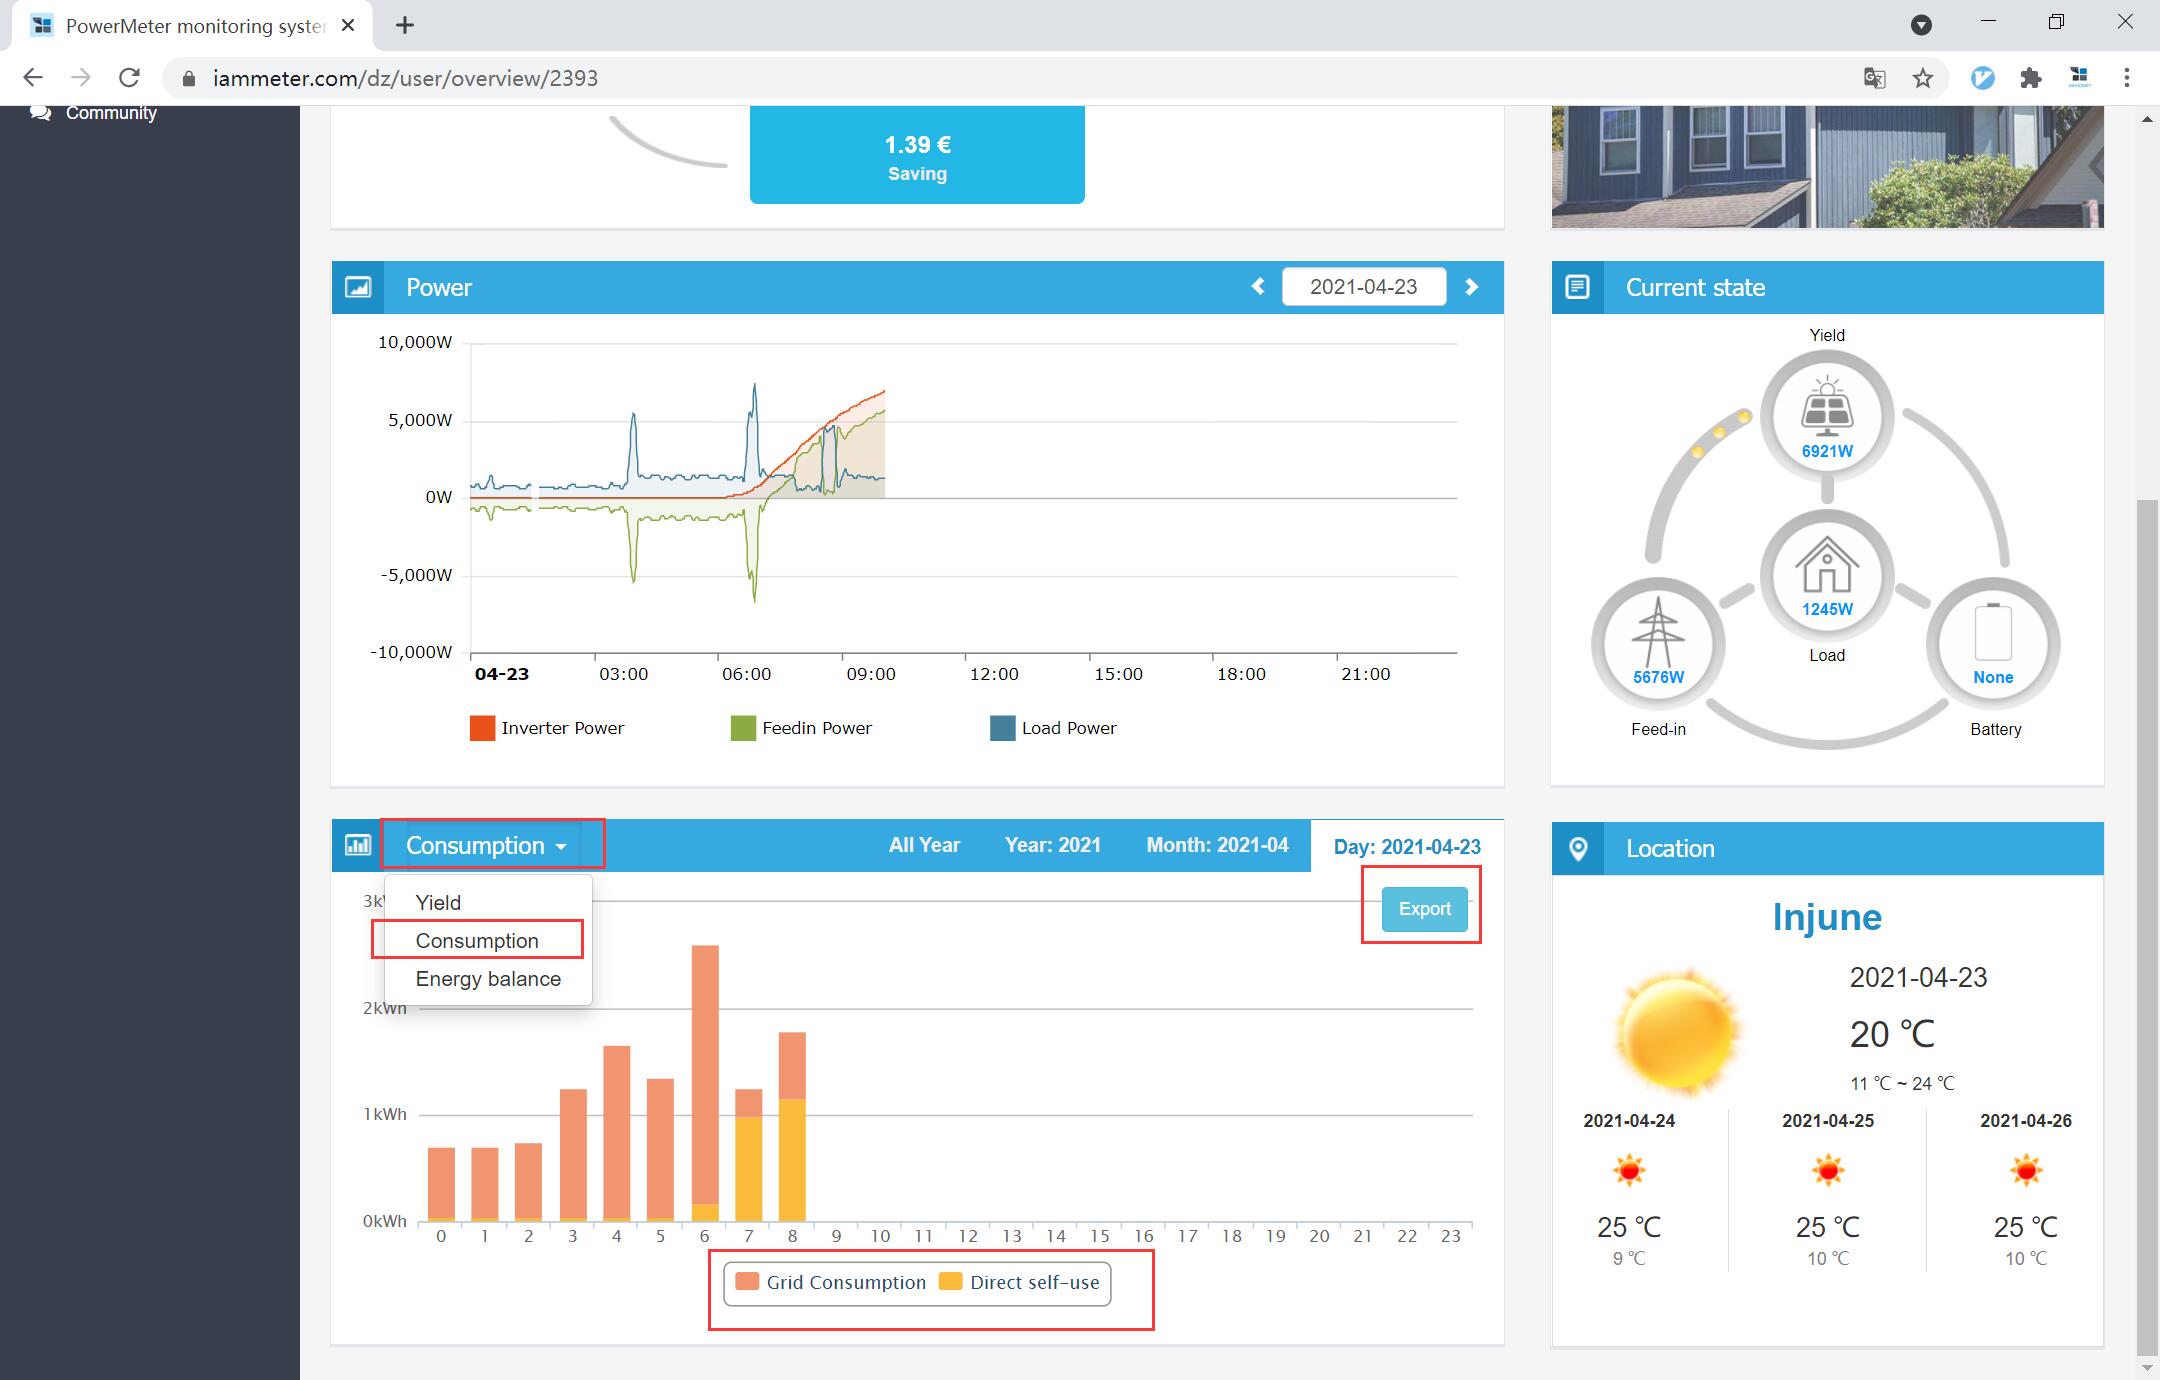
I would like to get a detailed as possible breakdown, by phase and minute of the amount of load I use. I am trying to find appliances consuming large power in my home. I need to know which graph shows, the difference between the invertor power (made from solar) and what is exported to grid, which would be the amount of power consumed within the house.
Can you please let me know how to set up the system?

Hi:
"I believe I have the grid sensors in the correct orientation because I turned of the invertor and the power reading went postive. I understood that that a positive value for the power indicates power coming into my house from the grid and a negative value indicates power export to the grid."
Your above understanding is absolutely correct.
"I would like to get a detailed as possible breakdown, by phase and minute of the amount of load I use. I am trying to find appliances consuming large power in my home. I need to know which graph shows, the difference between the invertor power (made from solar) and what is exported to grid, which would be the amount of power consumed within the house."
The load power and energy is calculated by IAMMETER cloud ,not measure directly by energy meter.
We have not provided the other report to analyze load power and energy yet, except this graph. But this graph is not by phase and 1 min interval.
Is this something that you plan to release? It's a vital feature and to be honest the only reason I bought your devices. I need to measure accurately the load. The data must be available as it is shown in the "current state".
You think it would easy to do in HA/Grafana?
we have understand what you need now.
If there are more customer require same feature in future. we will consider put this feature in our roadmap .
The HA and grafana is totally open solution, you can try it by yourself firstly. If it solve your requirements finally, welcome to post it here.