Report: Energy consumption during selected hour
This report is primarily aimed at aiding in the analysis of energy consumption.
By comparing energy usage during different time periods, it aims to identify potential power-consuming behaviors to help reduce expenses on utility bills.
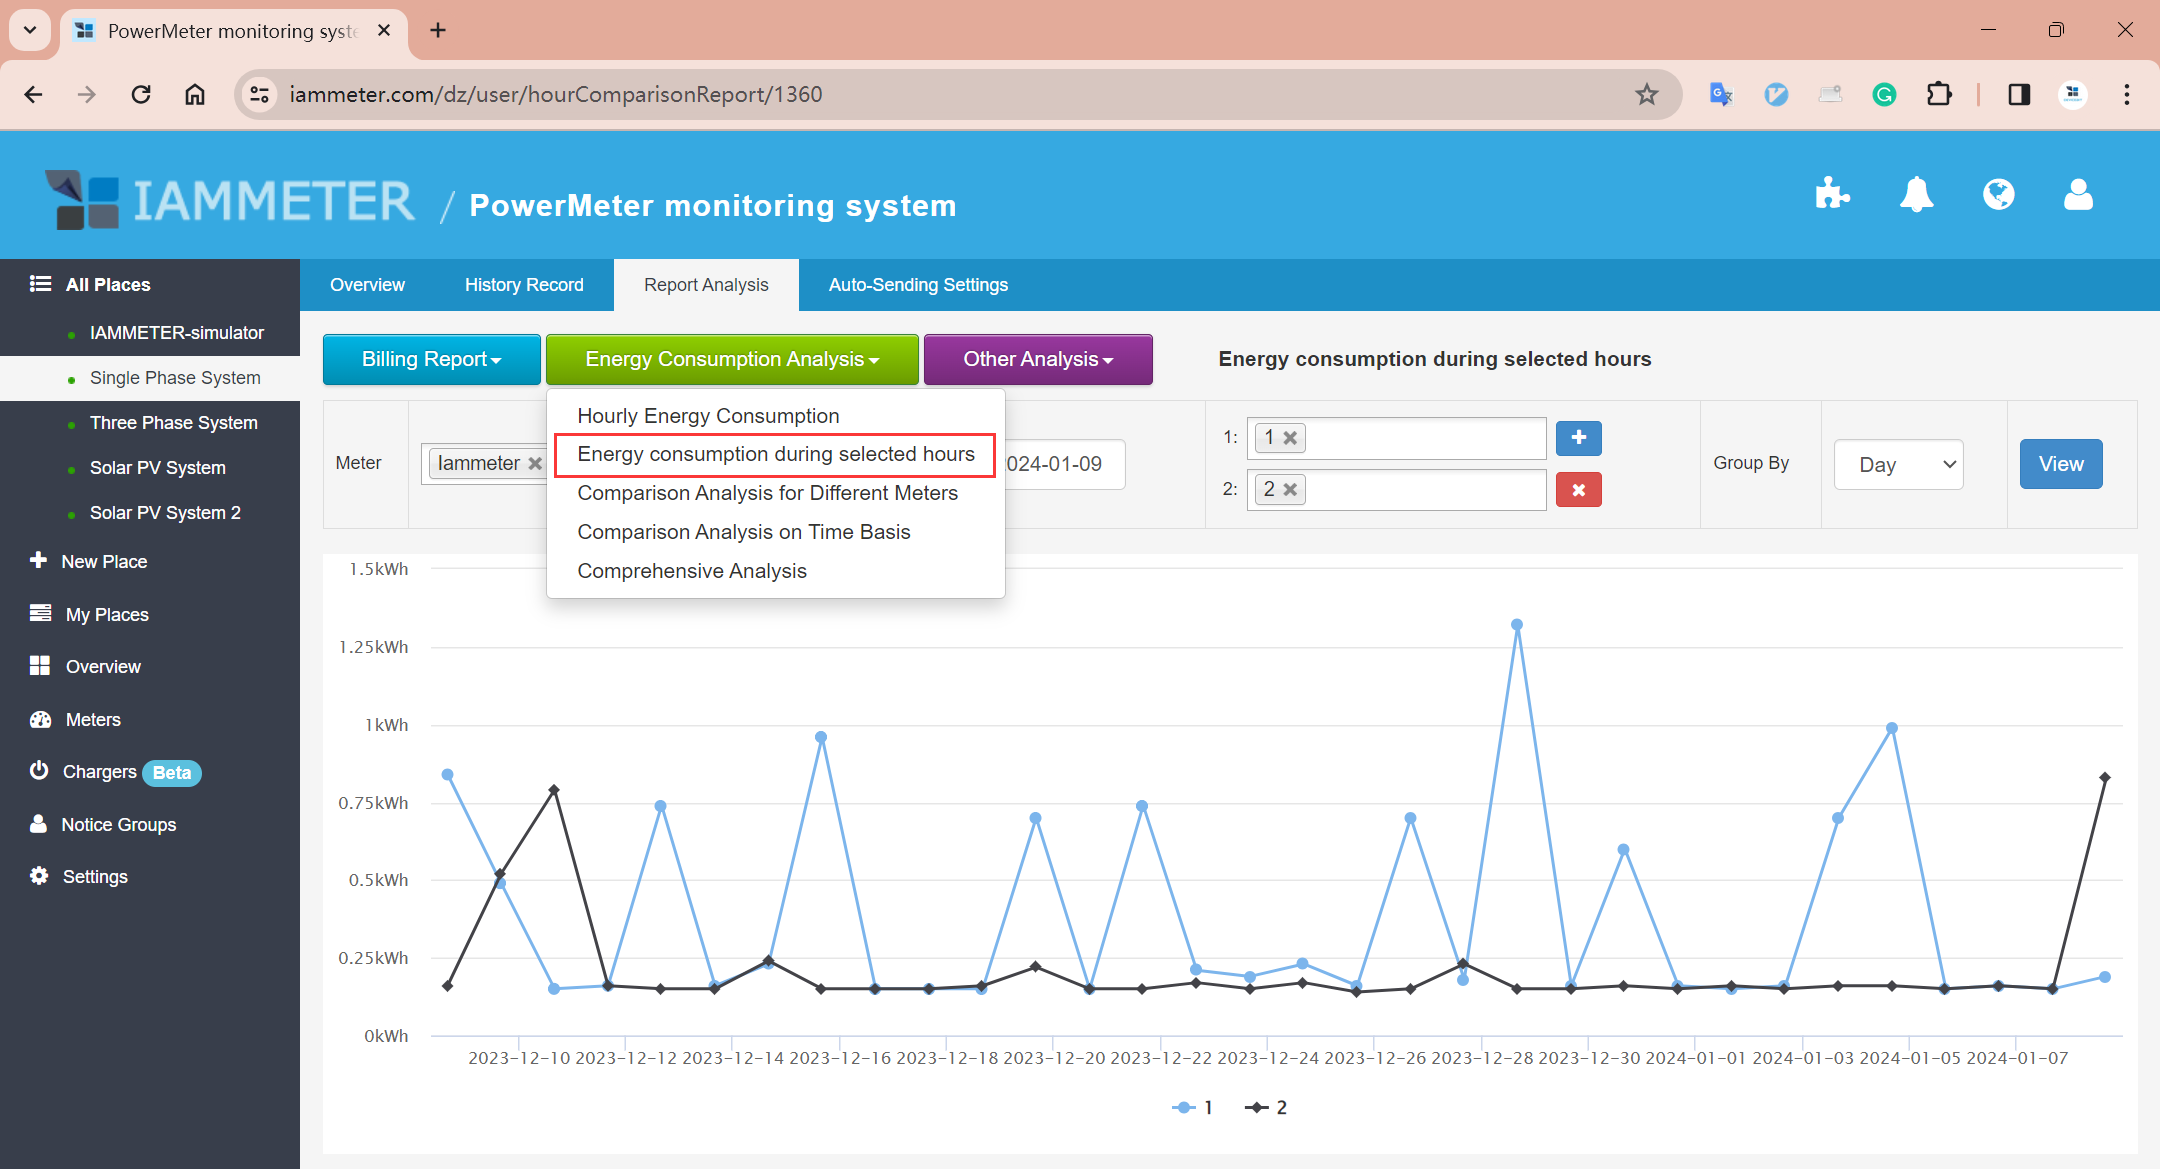
Report Analysis-> Energy Consumption Analysis->Energy consumption during selected hour
The report offers the following outputs:
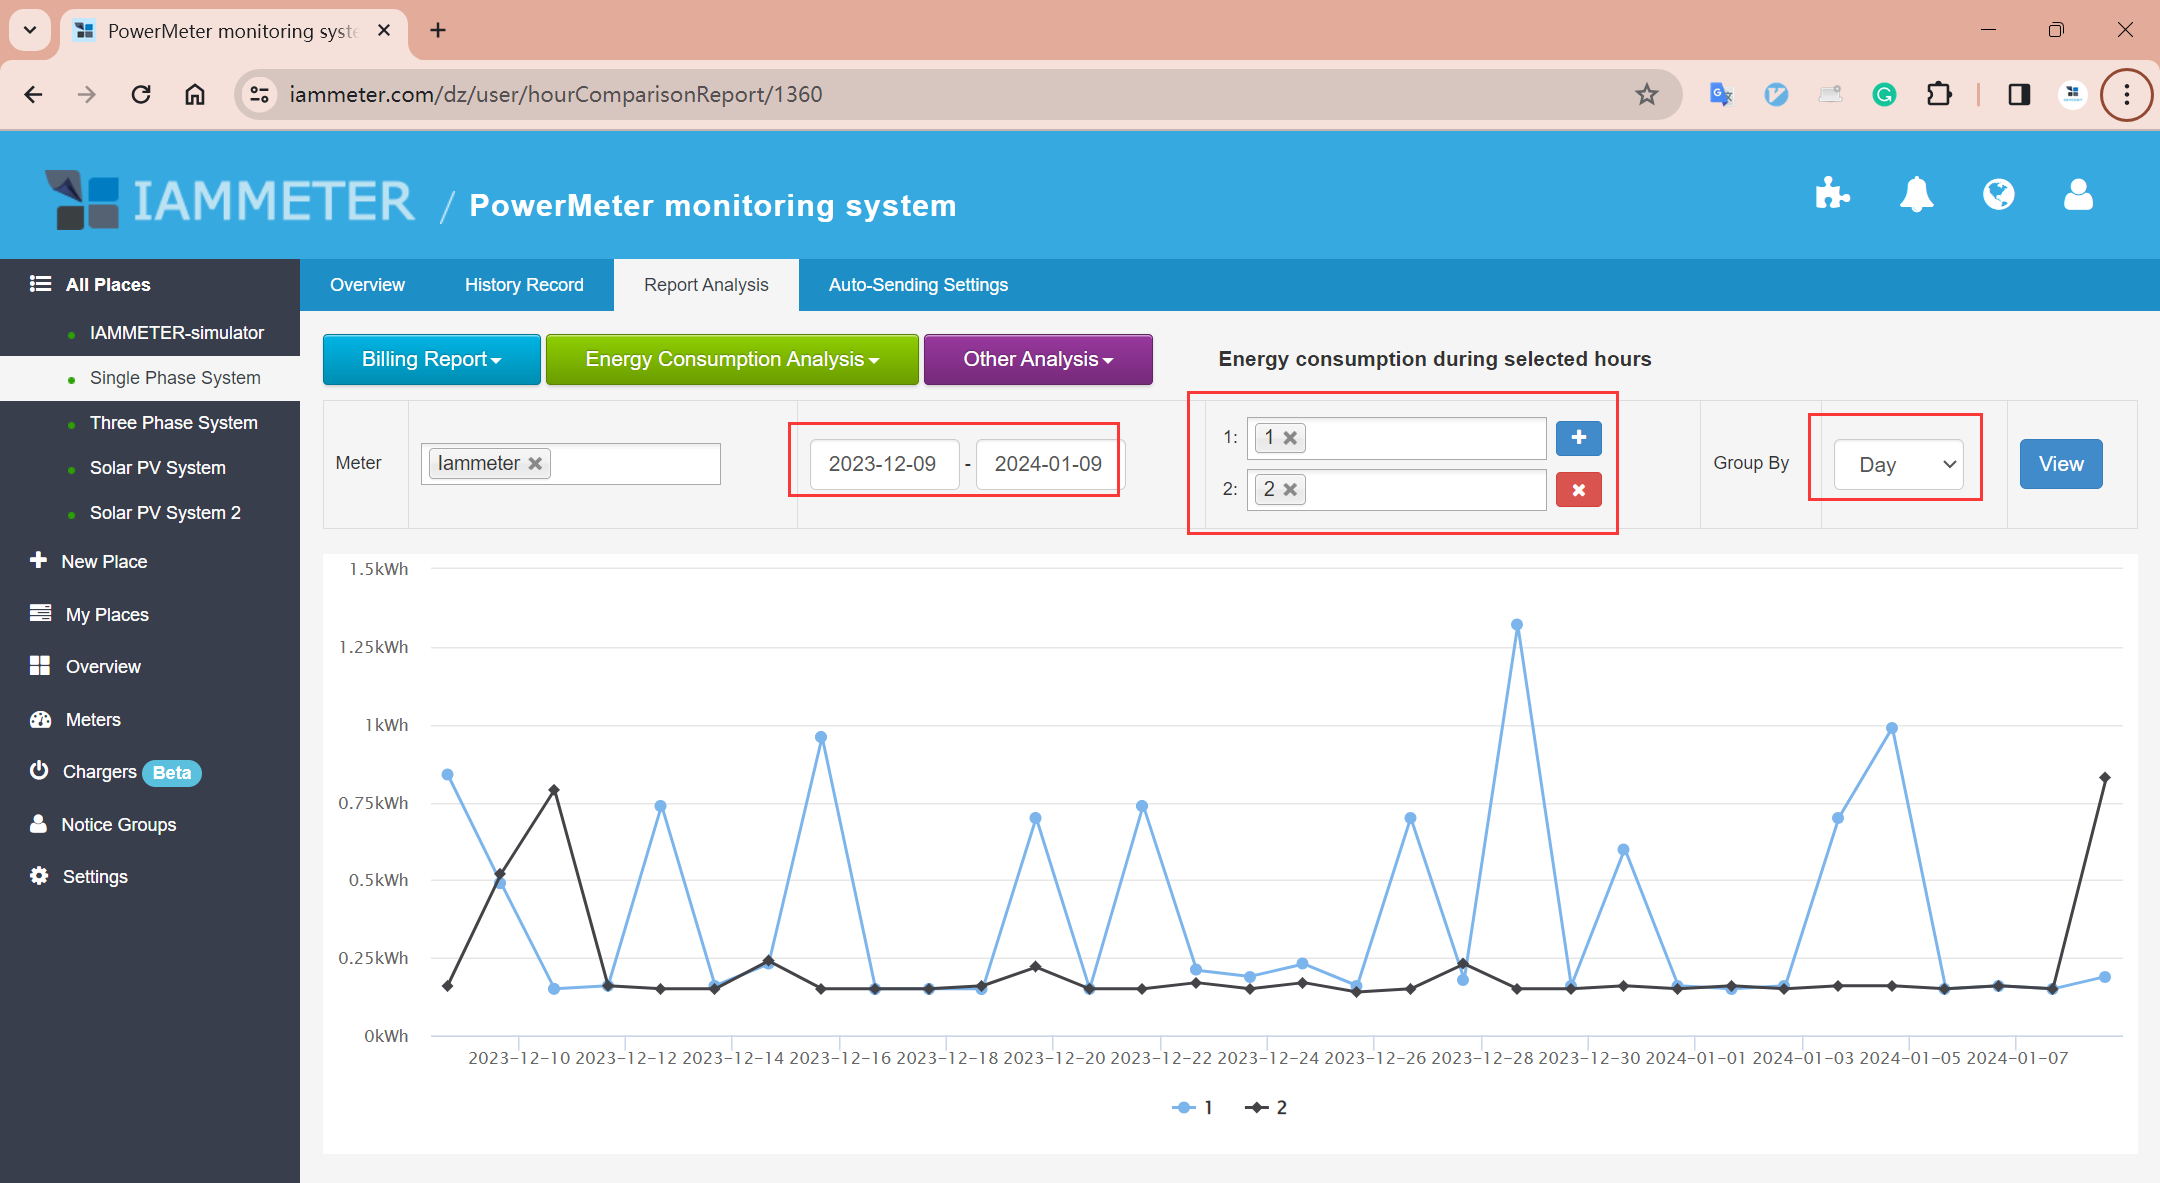
A comparison of energy consumption within different hourly ranges for each day .
A comparison of energy consumption within different hourly ranges for each month (summarizing the energy usage during those chosen hours across all days within that month).
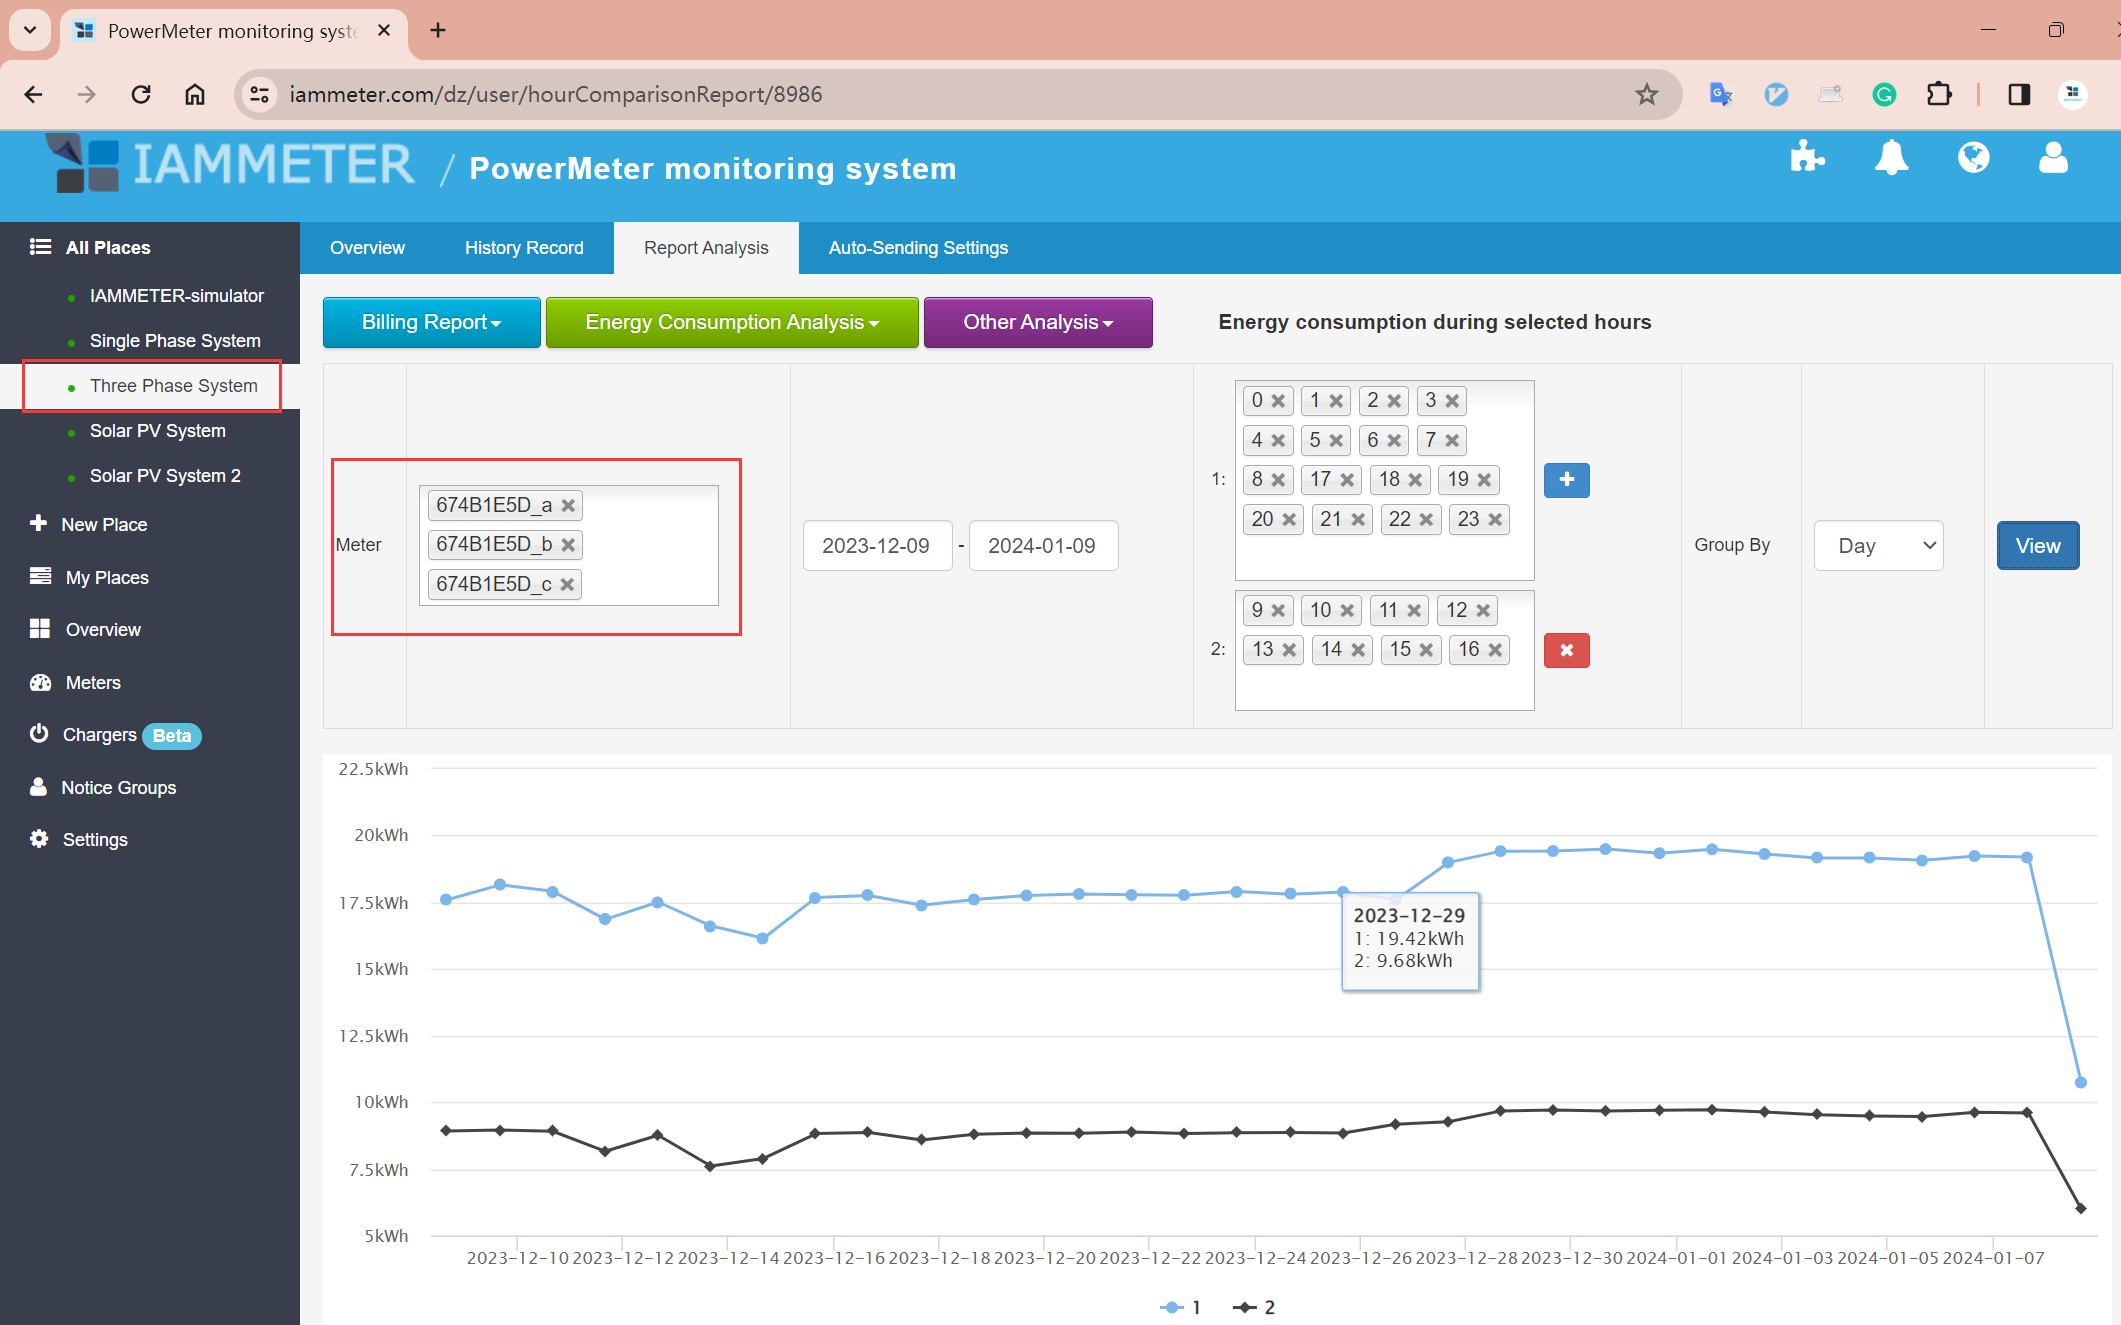
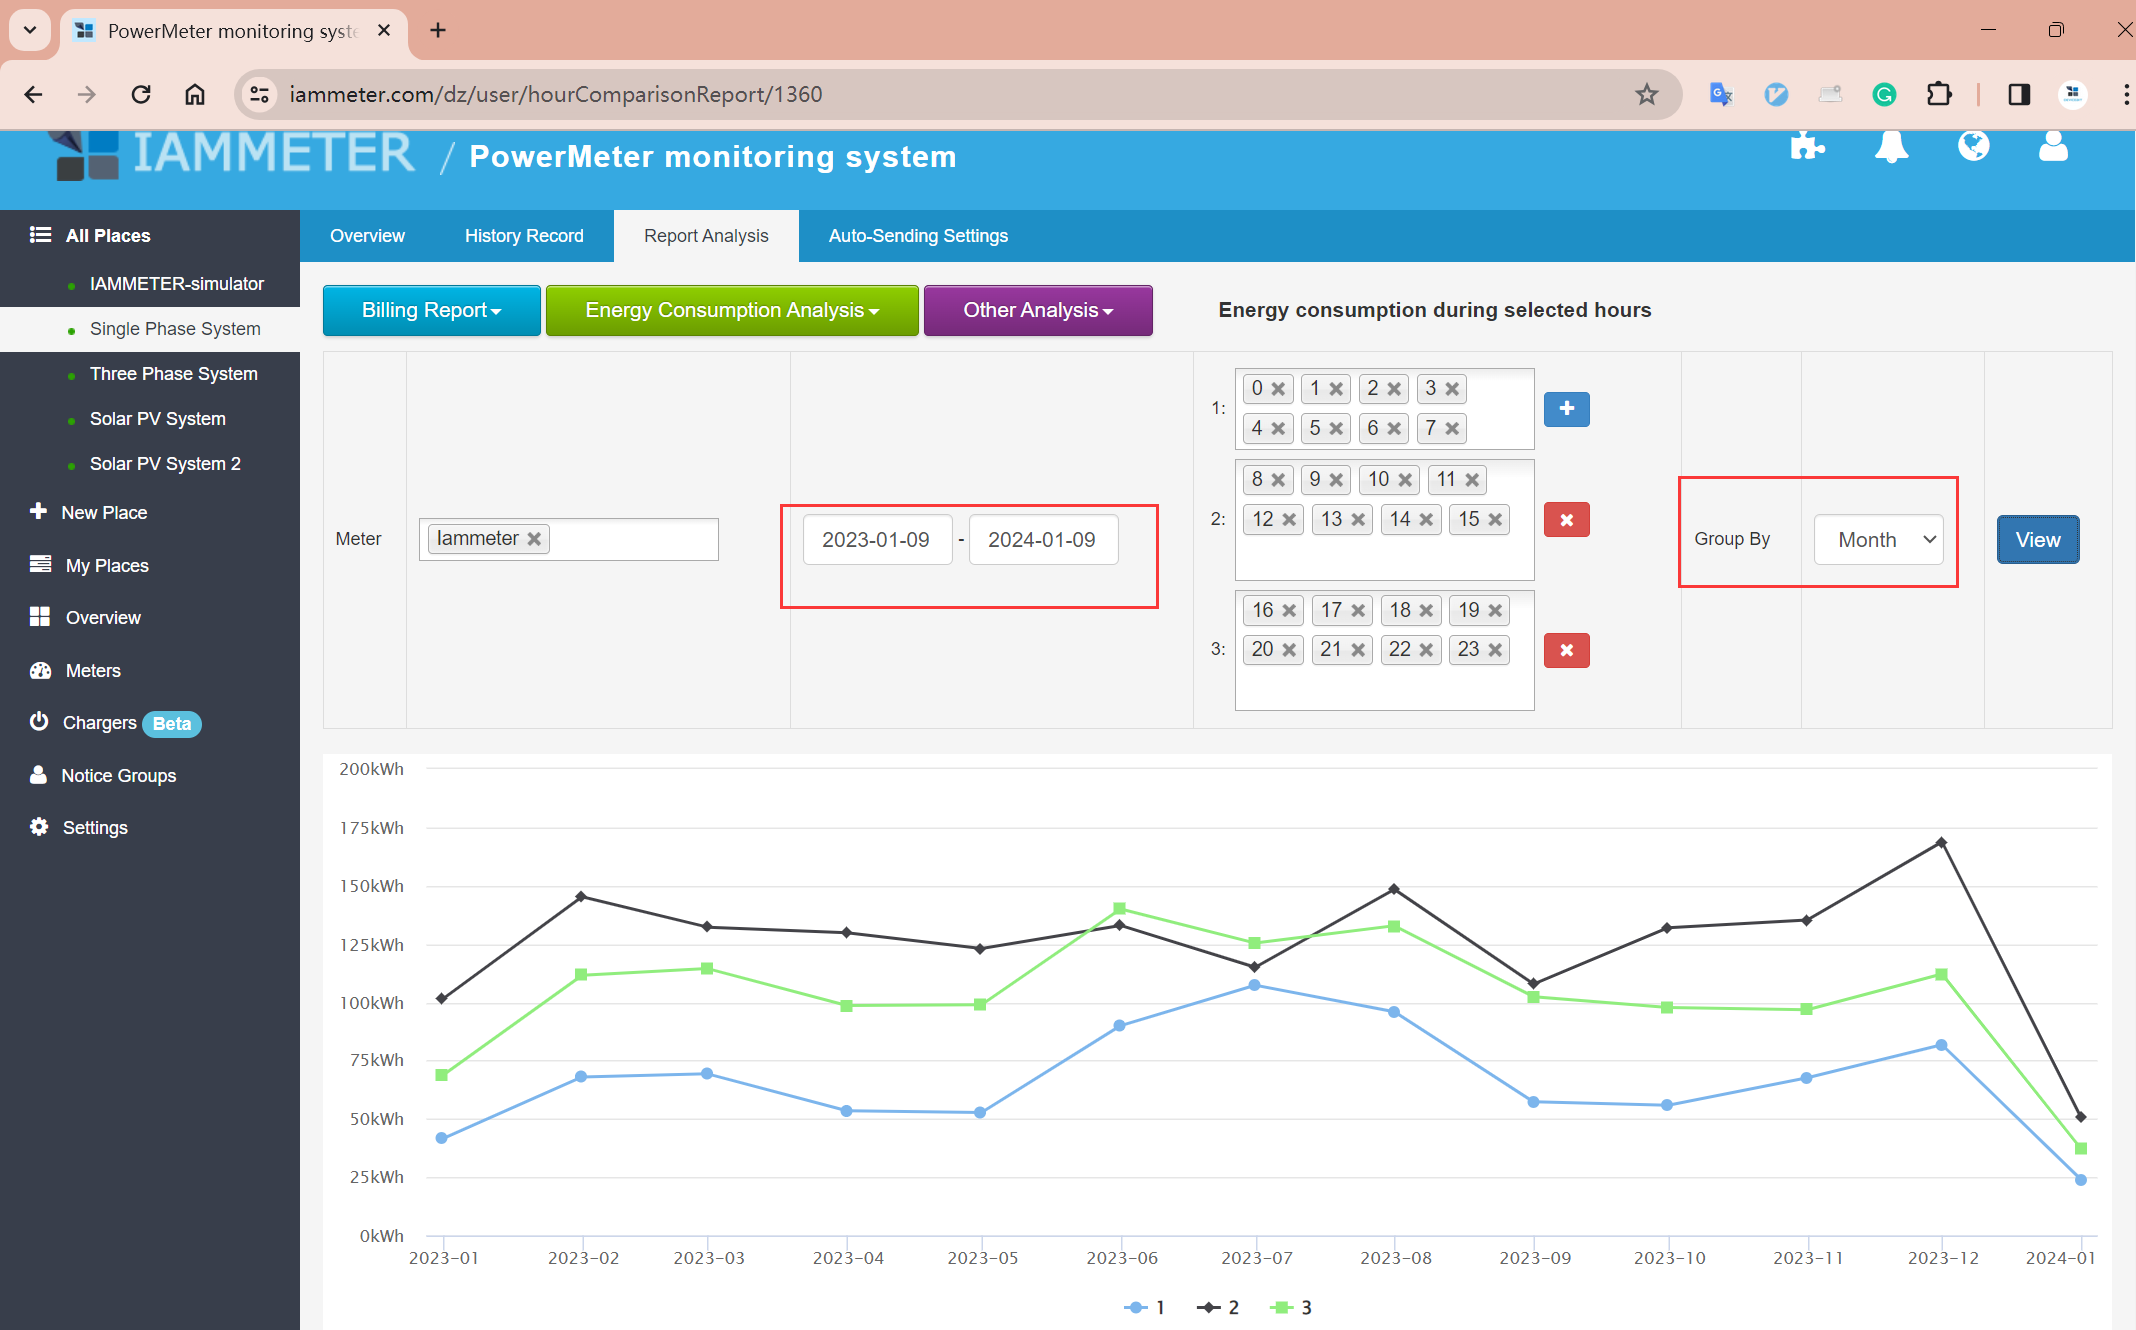
The figure below illustrates a comparison of energy consumption between the first hour and the second hour of each day within a monthly time frame(Oct 9th 2023 - Jan 9th 2024 ).
Primary Application Scenarios
This report can be used in scenarios that require comparing energy consumption across different time periods,such as below.
Analyzing the energy consumption across different shifts or teams within a factory
Comparing on a daily basis
Assuming there are three production shifts in the factory, corresponding to three different timeframes: 0:00-8:00, 8:00-16:00, and 16:00-24:00.
You can easily compare the daily energy consumption of these three production shifts using this report.
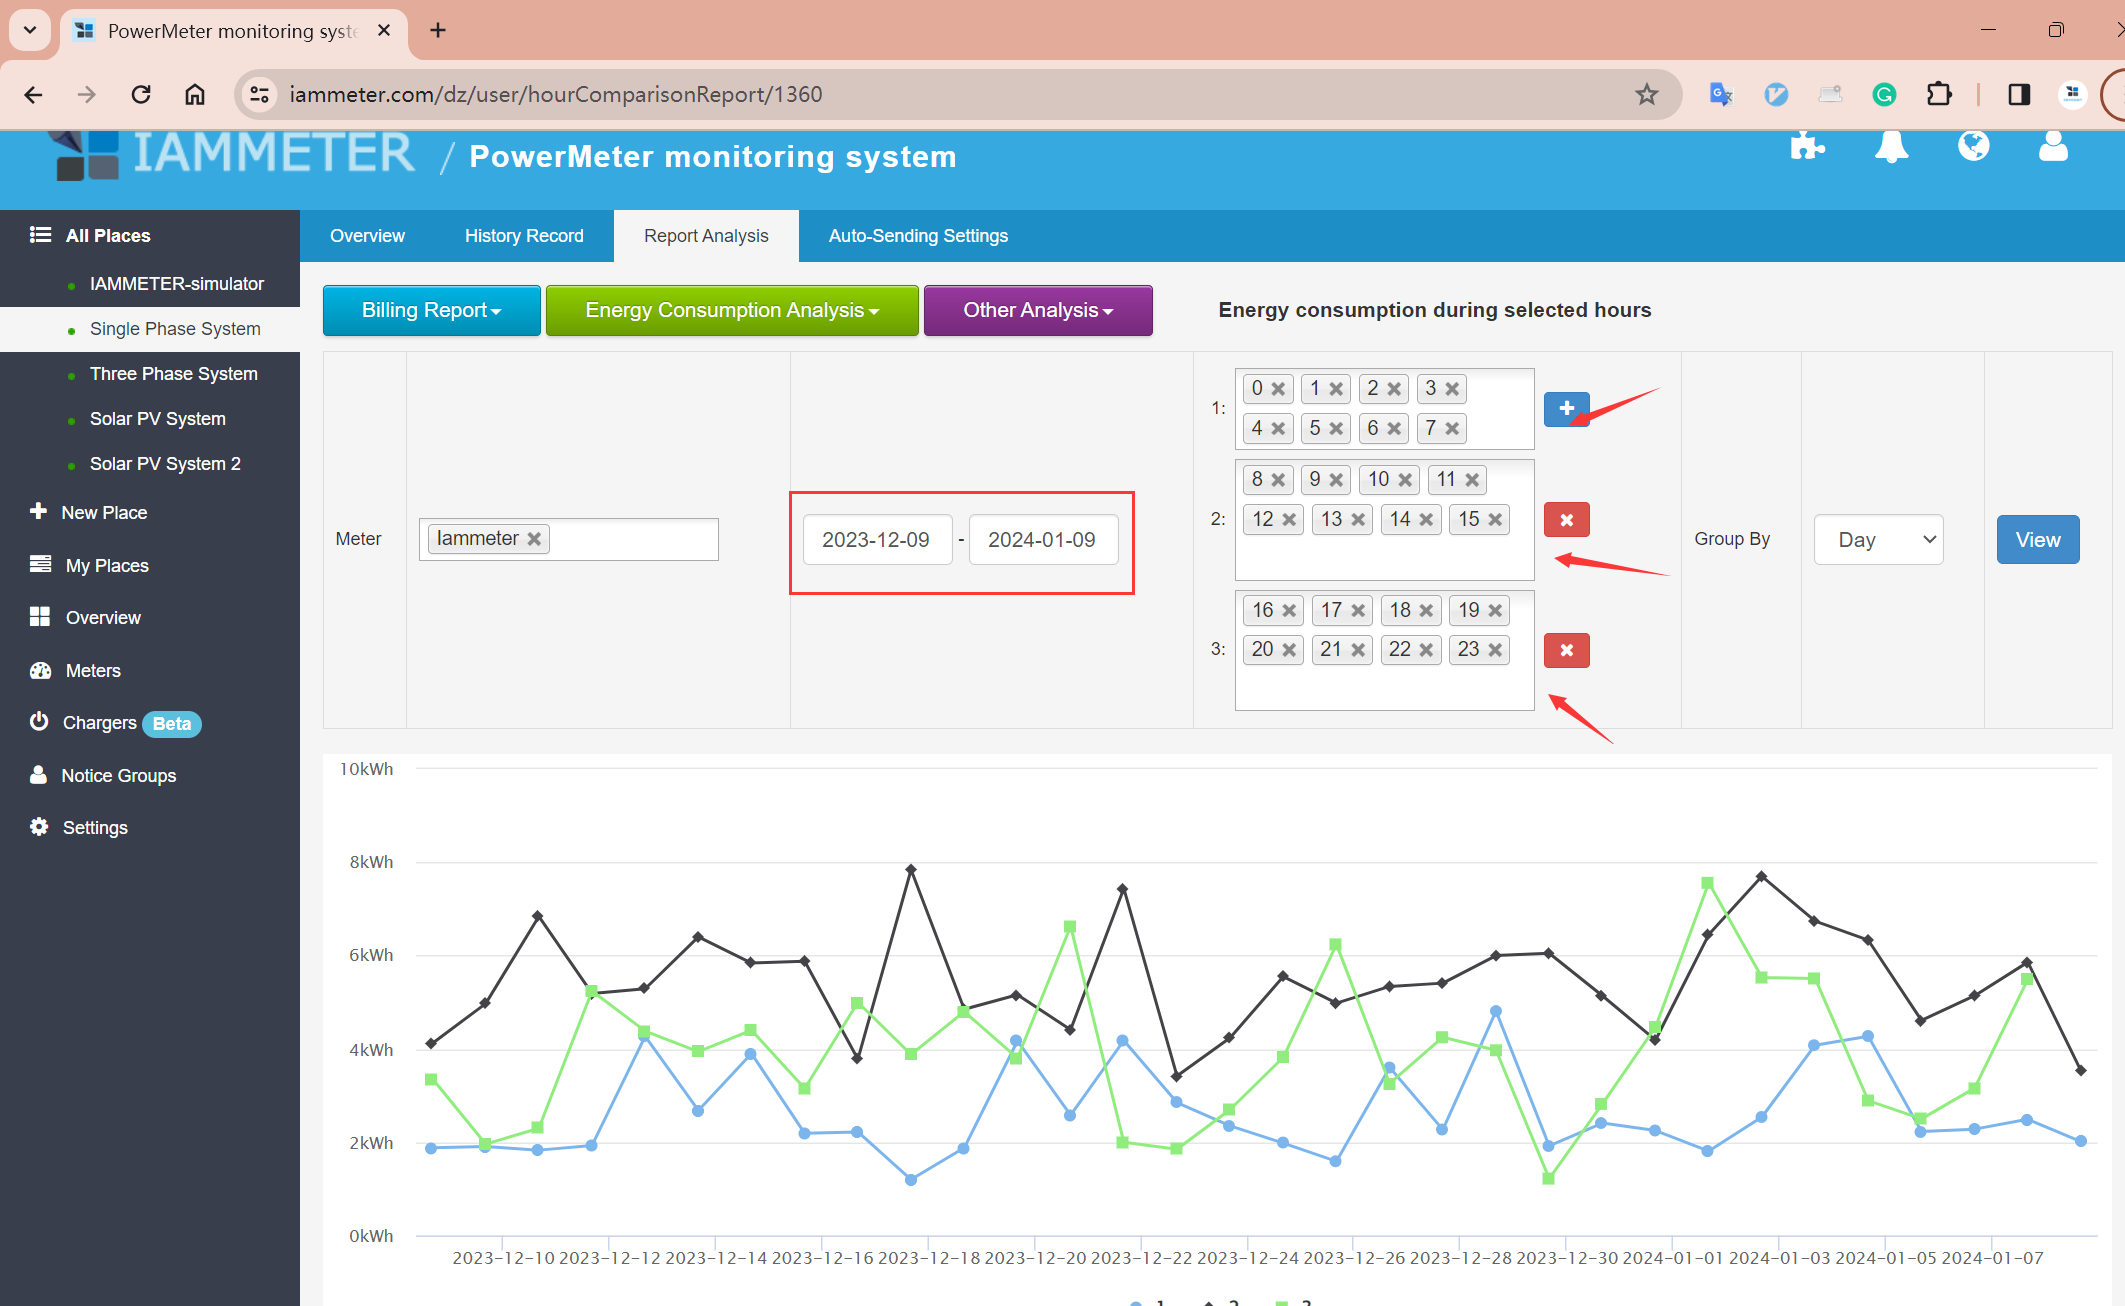
Comparing on a monthly basis
Comparison can be done not only on a daily basis but also on a monthly basis. When comparing on a monthly basis, the energy consumption values for this hour across all days within a month are summed up.
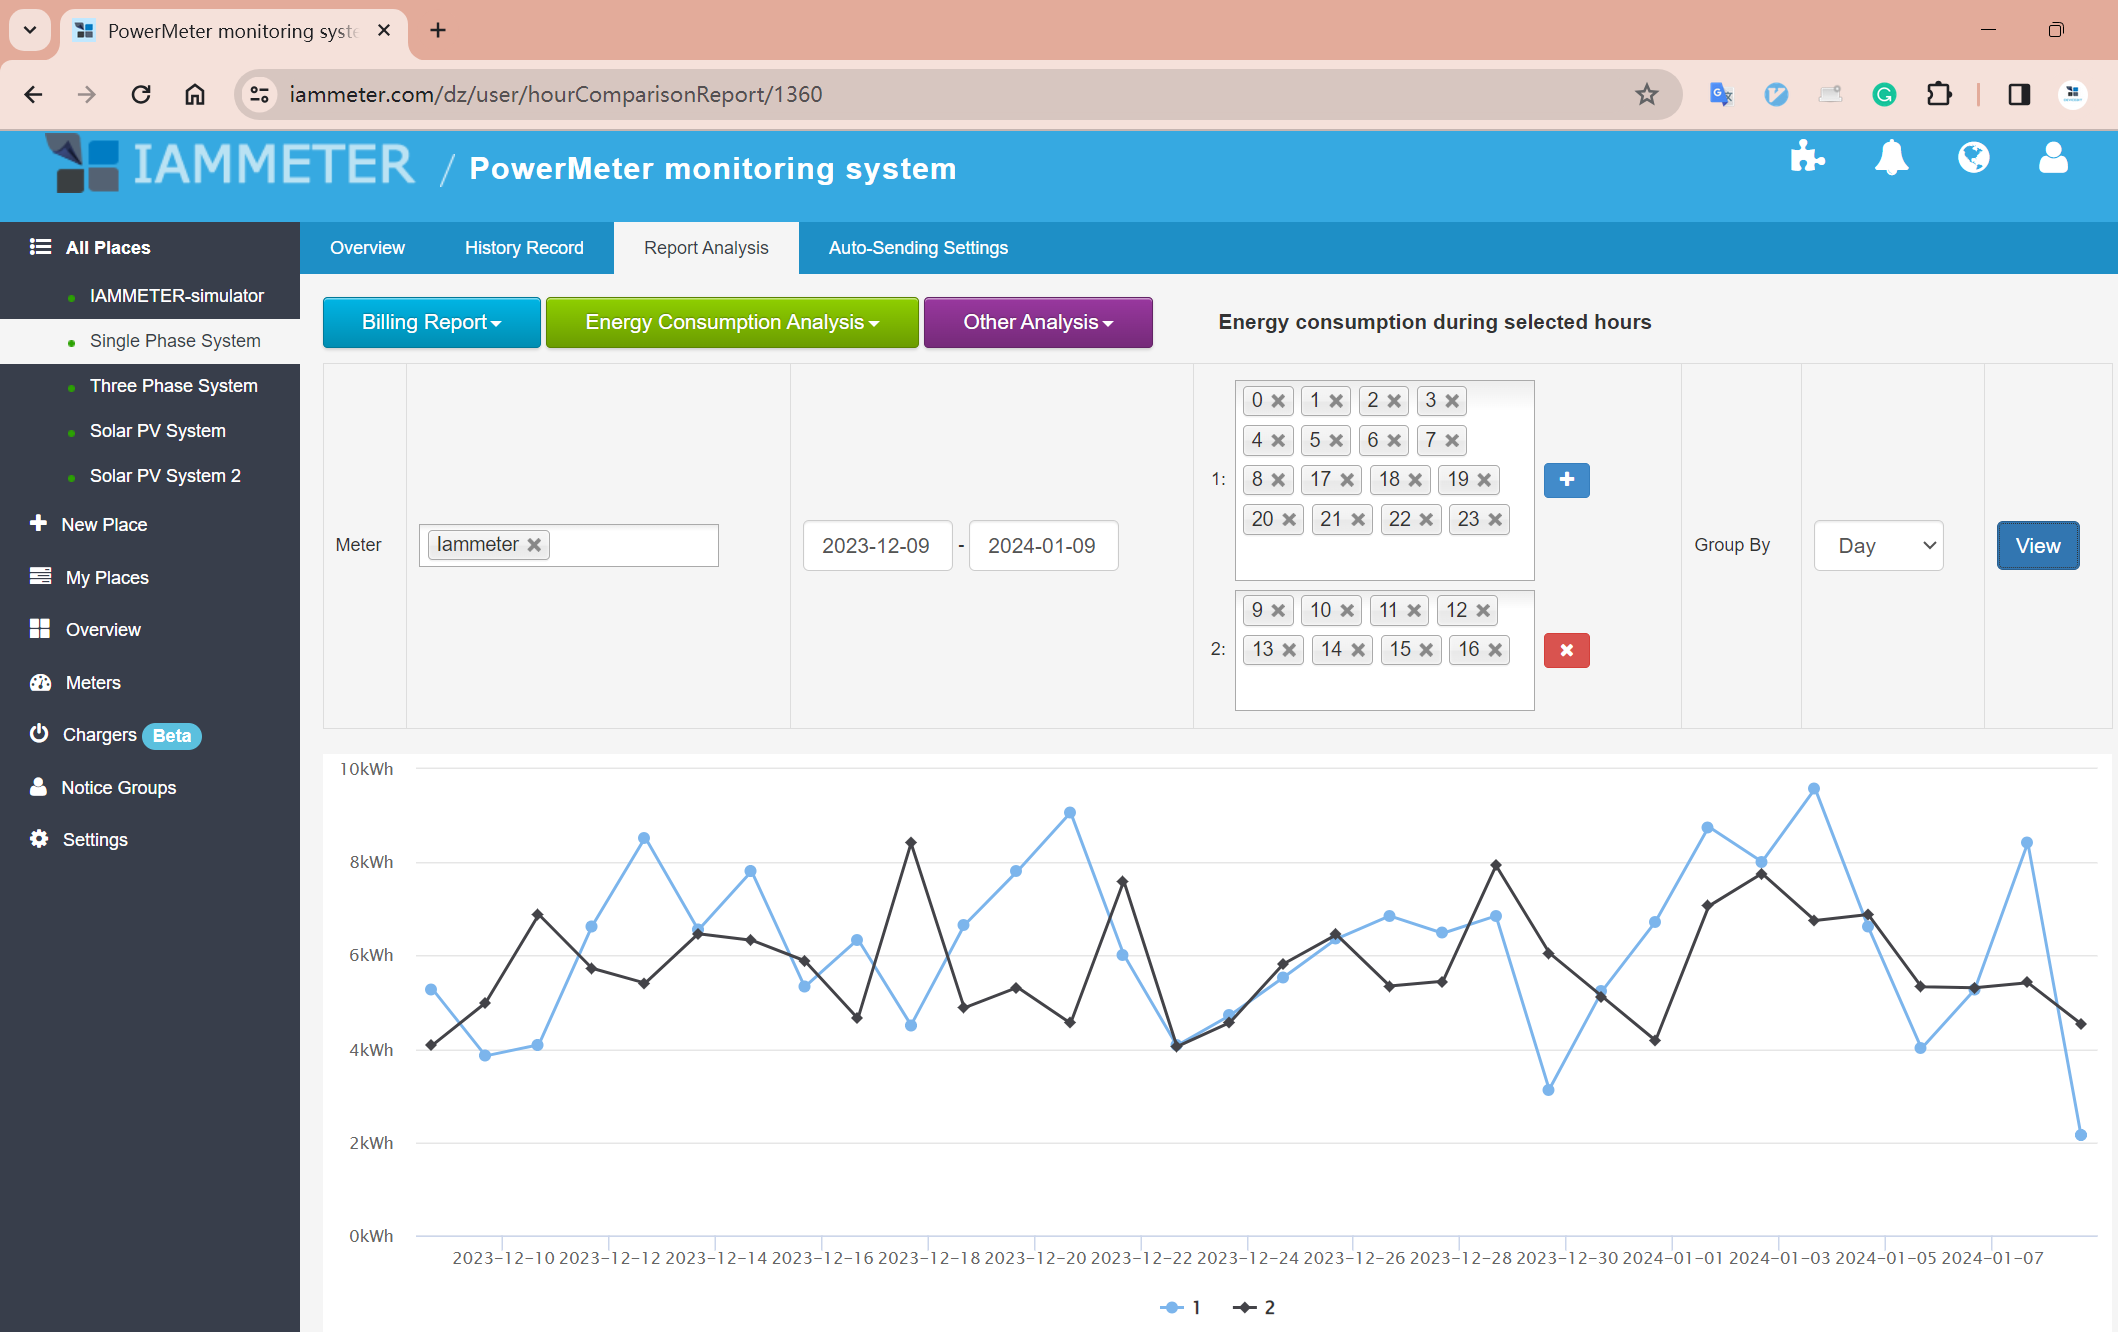
Comparing the energy consumption differences between office working hours and non-working hours
This report can also be utilized to analyze the energy consumption differences between office working hours and non-working hours,like below (Assuming that 9:00 AM to 3:00 PM is considered working hours, while the remaining time is considered non-working hours):
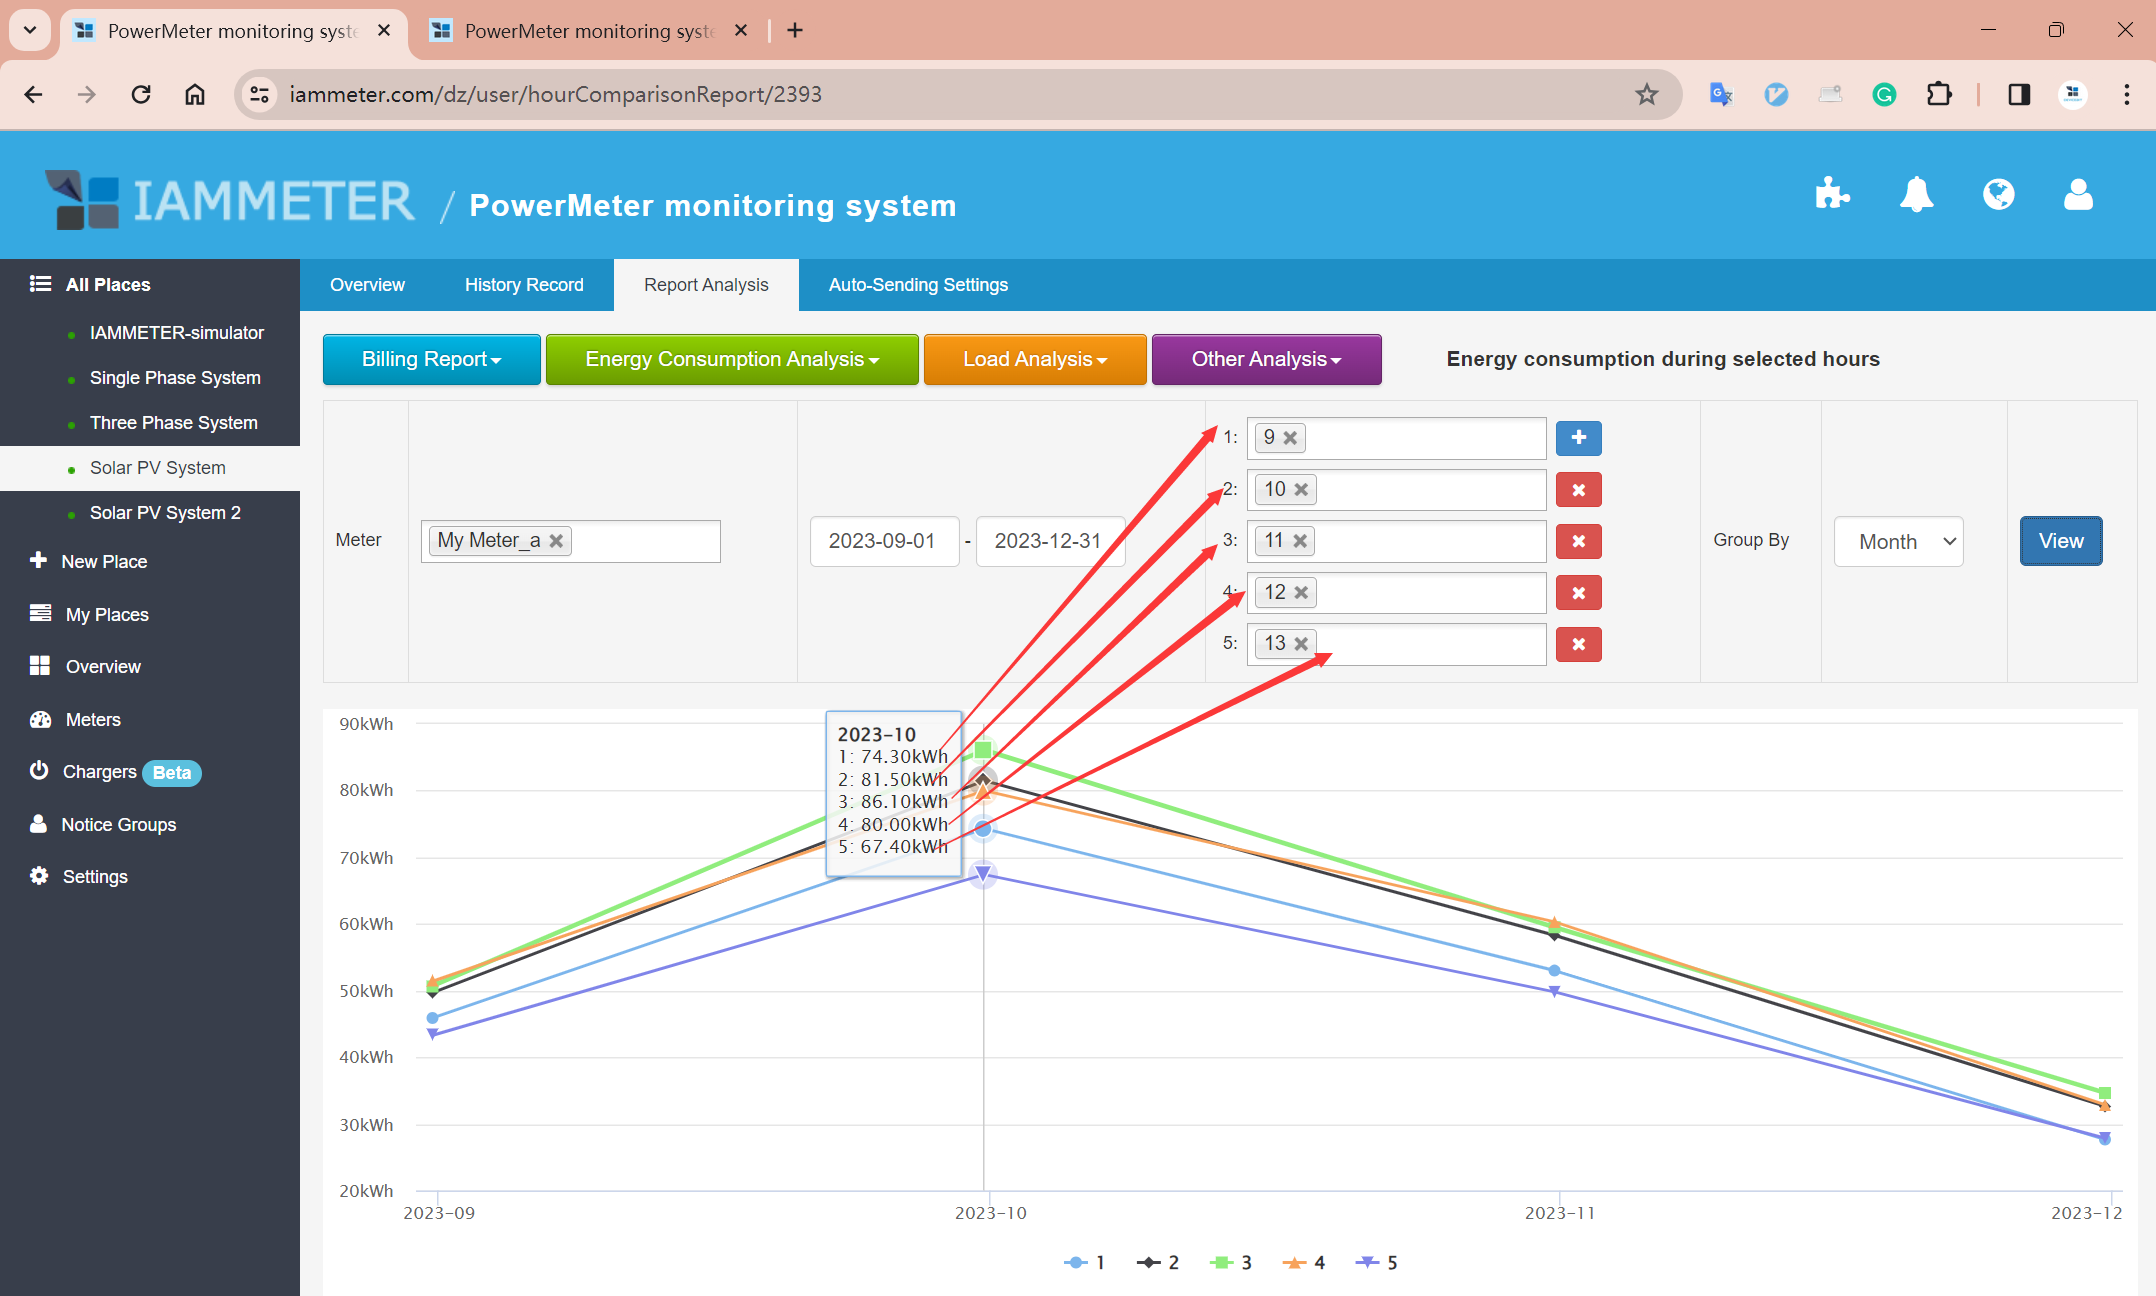
Comparing the hourly photovoltaic (PV) electricity generation
The chart below analyzes the photovoltaic electricity generation between 9:00 AM and 1:00 PM every day from September to the end of December 2023. As a monthly comparison is selected, the value at each point represents the total generation at that time across all days within that month.
Three-phase electricity meters in the report
All IAMMETER's 3-phase meters (WEM3080T,WEM3046T,WEM3050T) support both 3-phase and split-phase measurement.
Concerning the 3-phase meter, this report allows for the analysis of either each phase individually or the total sum of all phases' energy consumption.
If you wish to analyze a single phase of the three, simply select the corresponding phase. If you select multiple phases, the results will pertain to the combined sum of the selected phases.