PVoutput Consumption data blows out at the current read throughout the day, with all the consumption reads accurate, then the energy used has a large spike which rolls throughout the day, then at the end of the day energy used anywhere in the portal for that day has this exaggerated read.
The workaround which is annoying is to download all this information, then use the live loader to only load the power and generation used figures
https://pvoutput.org/intraday.jsp?id=32148
There seems to be very little information on this pvoutput integration and troubleshooting issues like this, or some negative figure value issues I was having early on.
It would be great to be able to select what information we are uploading to PVoutput, for example turn off any of the energy figures and have PVOutput automatically summarise these from the power figures uploaded.

Sorry.
I am a little confused about this question.
Is this question regarded to the IAMMETER`s product or system?
Or only a question about the pvoutput?
Hi,
The IAMMeter docker container, pvoutput upload integration. The IAMMeter docker seems to upload rolling consumption data to pvoutputs energy consumption side that is wrong over-inflated, or am I wrong IAMeter only uploads power consumption?
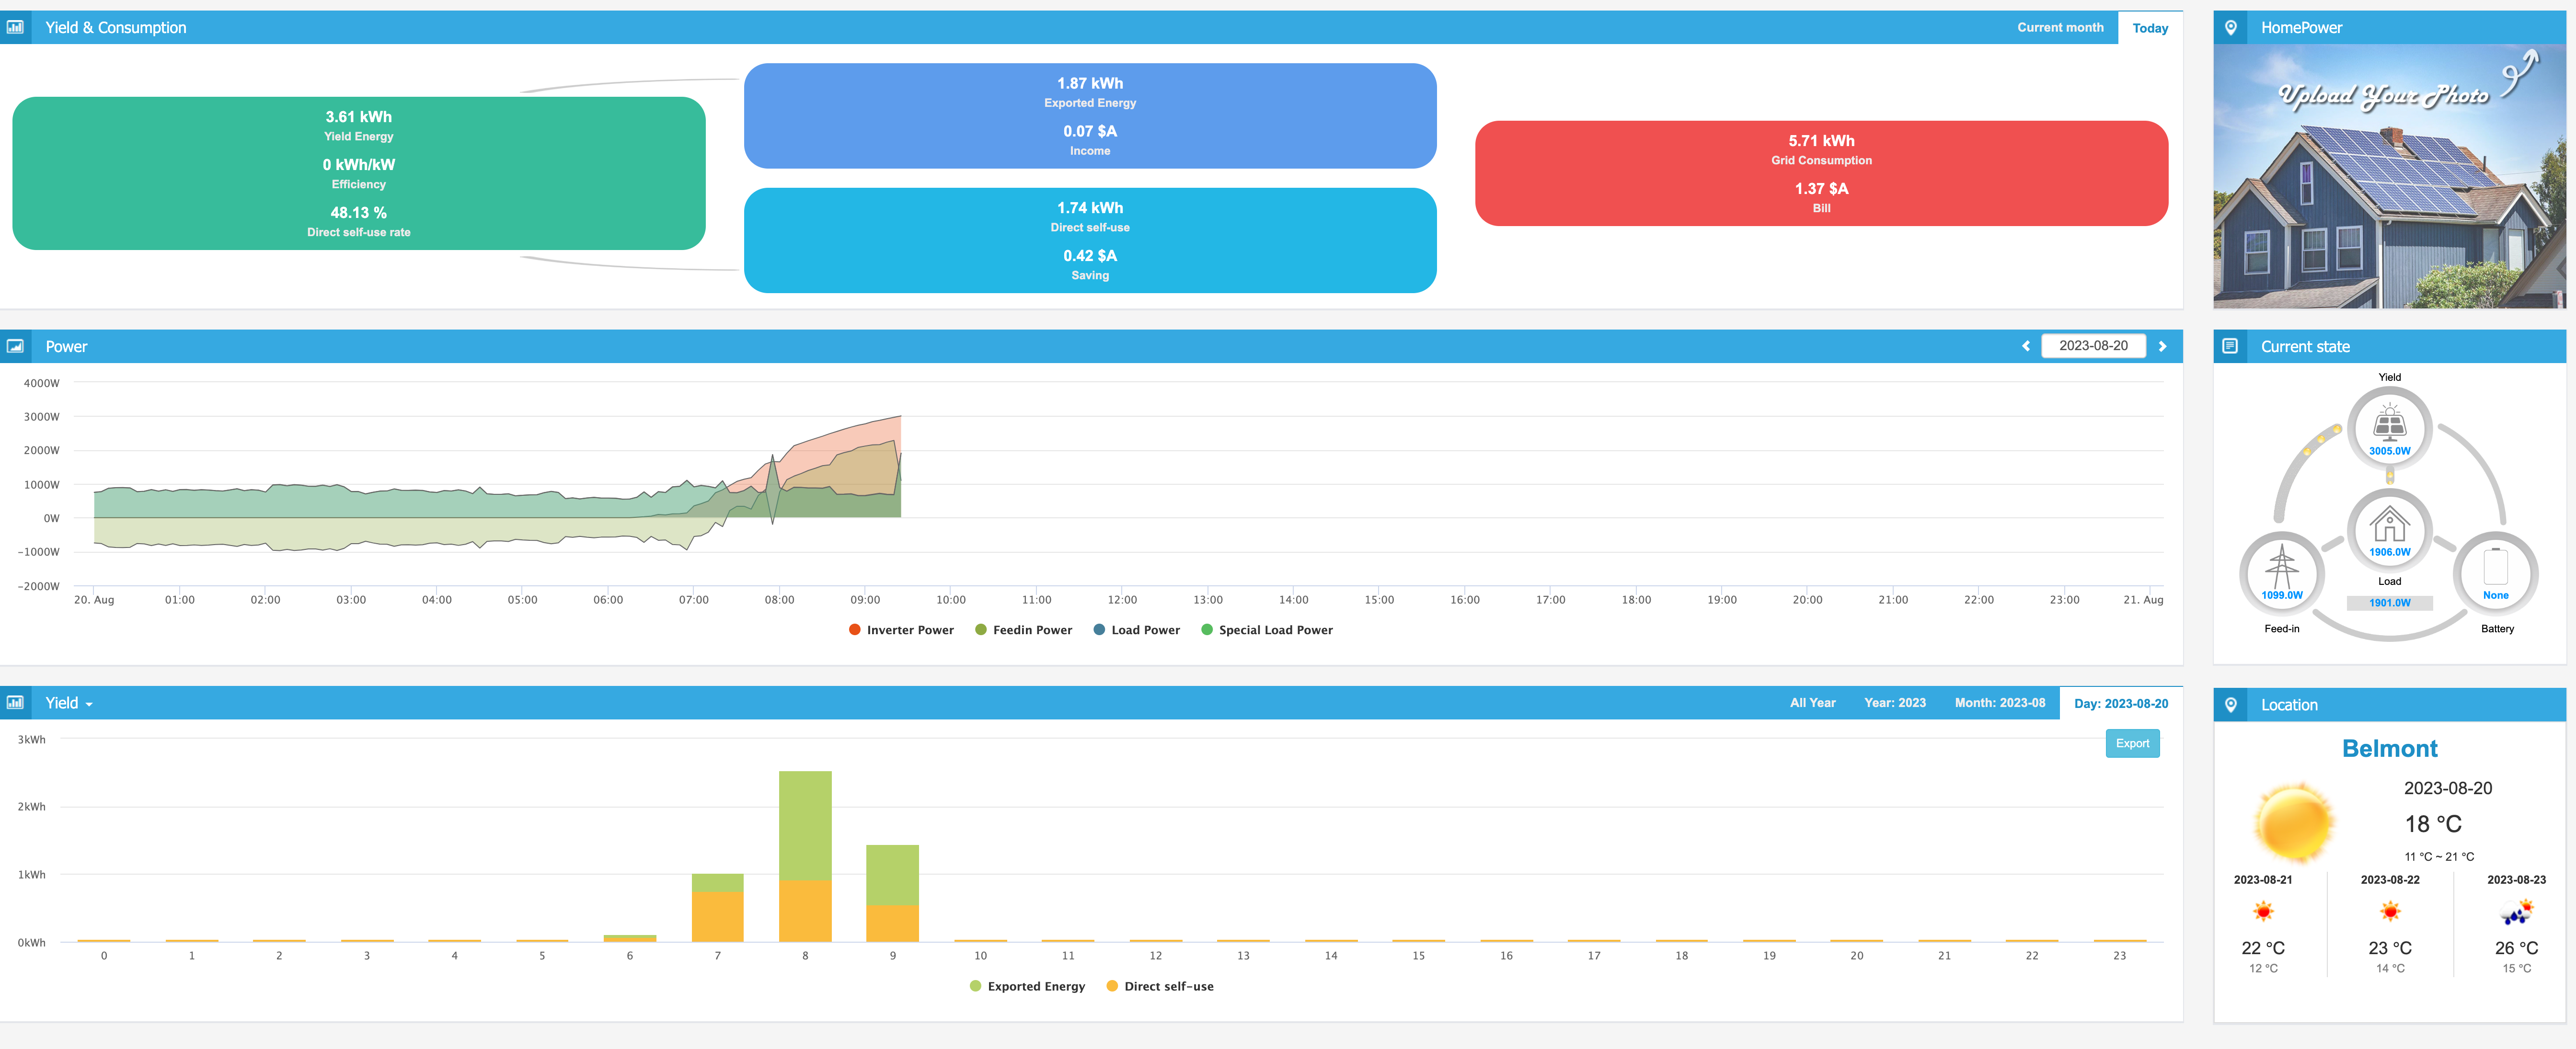
Here are some samples of what I am talking about, All the ones below the line are correct where I have downloaded the data and uploaded just with any of the energy used or generation figures, this way PVOutput automatically calculated these correctly. 11-13KW per day (correct), vs 9 to 35KW (incorrect), it appears the IAMMeter upload to PVOutput is adding the Generation to the Consumption figures, the clamp setup I have was the only way I could get any uploads to PVOutput, due to previous errors about negative figures.

You will see the spike for every last reading throughout the day, highlighted are all the figures on the page that are incorrect due to the rolling energy usage spike.
Here is the end of the day

Here is a progression though the day


Hi:
1 Have you do some changes in Aug 3th?
2 Have you also used the IAMMETER-docker or IAMMETER-cloud for monitoring? If so, please provide me with some snapshots of the daily kWh
I need these 3 graphs to judge whether the IAMMETER-cloud has the same result as the PVoutput.
If they are different,I need to find out what causes this difference,
the energy meter or the IAMMETER-docker

Hi To your first question, no as per my opening post, I am downloading the data , and then using pvoutput live uploader to add power figures not the energy (cumulative total) figures, I let PVOutput automatically calculate these.
Here are the outputs from IAM meter cloud.


I think the problem is IAM meter docker, because the same views as shown above within the docker portal is completely different to this and also doesn't match PVOutput but everything except the rolling cumulative consumption looks correct. This was the only config I could use to get the iammeter-web and pvoutput to look as I would expect.


Hi,
Sorry for the inconvenience caused to you.
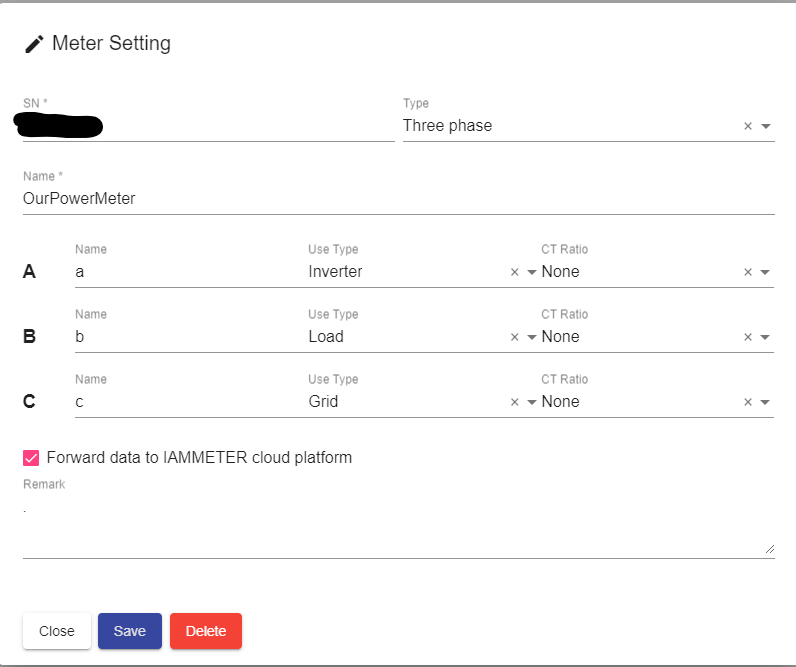
Please send the screenshot of the setting interface of the meter in the docker container, we will confirm that the setting is no problem.
BR
Can you please delete the previous post, because it seems that I am unable to, as I just realised the Serial Number is posted
Hi,
Deleted the pic.
We checked the logs and found that the data uploaded by the device is consistent with your previous screenshots, but the feed-in does not behave normally on the chart. Compared with the cloud pictures, we found the problem. Is the load and grid settings reversed in the docker app?
Hi:
I have discussed your issue with my colleague Wilson and we thought we had found your problem.
Please see these pics you provided before. The solar PV monitoring results are different between IAMMETER-docker and IAMMETER-cloud.
The grid power is totally different.
From the IAMMETER-docker,the feedin power is negative (import energy from the grid) during the night , this is normal.
But when the solar yield power is increasing,the feedin power became even lower, it means importing more grid power when the solar power is increasing,this is abnormal.
From the pic of the IAMMETER-cloud ,the feeding power is still negative during the night, but it change to positive as the solar began to yield, this is normal.

From these two pics , we found the solar pv power is nearly the same.
So we think the grid power reading is abnormal in IAMMETER-docker.
Because the grid power reading is still normal in IAMMETER-cloud, this problem has nothing to do with the energy meter ,but the IAMMETER-docker.
We also found there is a special load in your IAMMETER-cloud and it increases dramatically sometimes (I circle it in red), it is very like the grid power in the IAMMETER-docker.
So we thought the meter type setting is IAMMETER-docker is wrong now.
In IAMMETER-docker ,the meter type of the "grid" should be "load" and the meter type of the "load" would be "grid".
Please compare the meter type setting between IAMMETER-cloud and IAMMETER-docker.
I think someone changes this setting of the IAMMETER-docker on Aug 3rd ,from this time, the value displayed on pvoutput starts abnormally.
Thank you so much, and for your patience, I seem to recall when I had it set like this the figures were all over the place.
We use net metering here in Australia, which is not yet supported by the docker container, could be part of the problem?
I have changed as per your recommendation I believe the correct place as below
Now the docker container looks fine and matches the cloud graphs which is great, but now the PVOutput stopped uploading straight after this change, with errors of negative values, the problem I had before, which is why I changed it to the running config I had prior.
Samples Below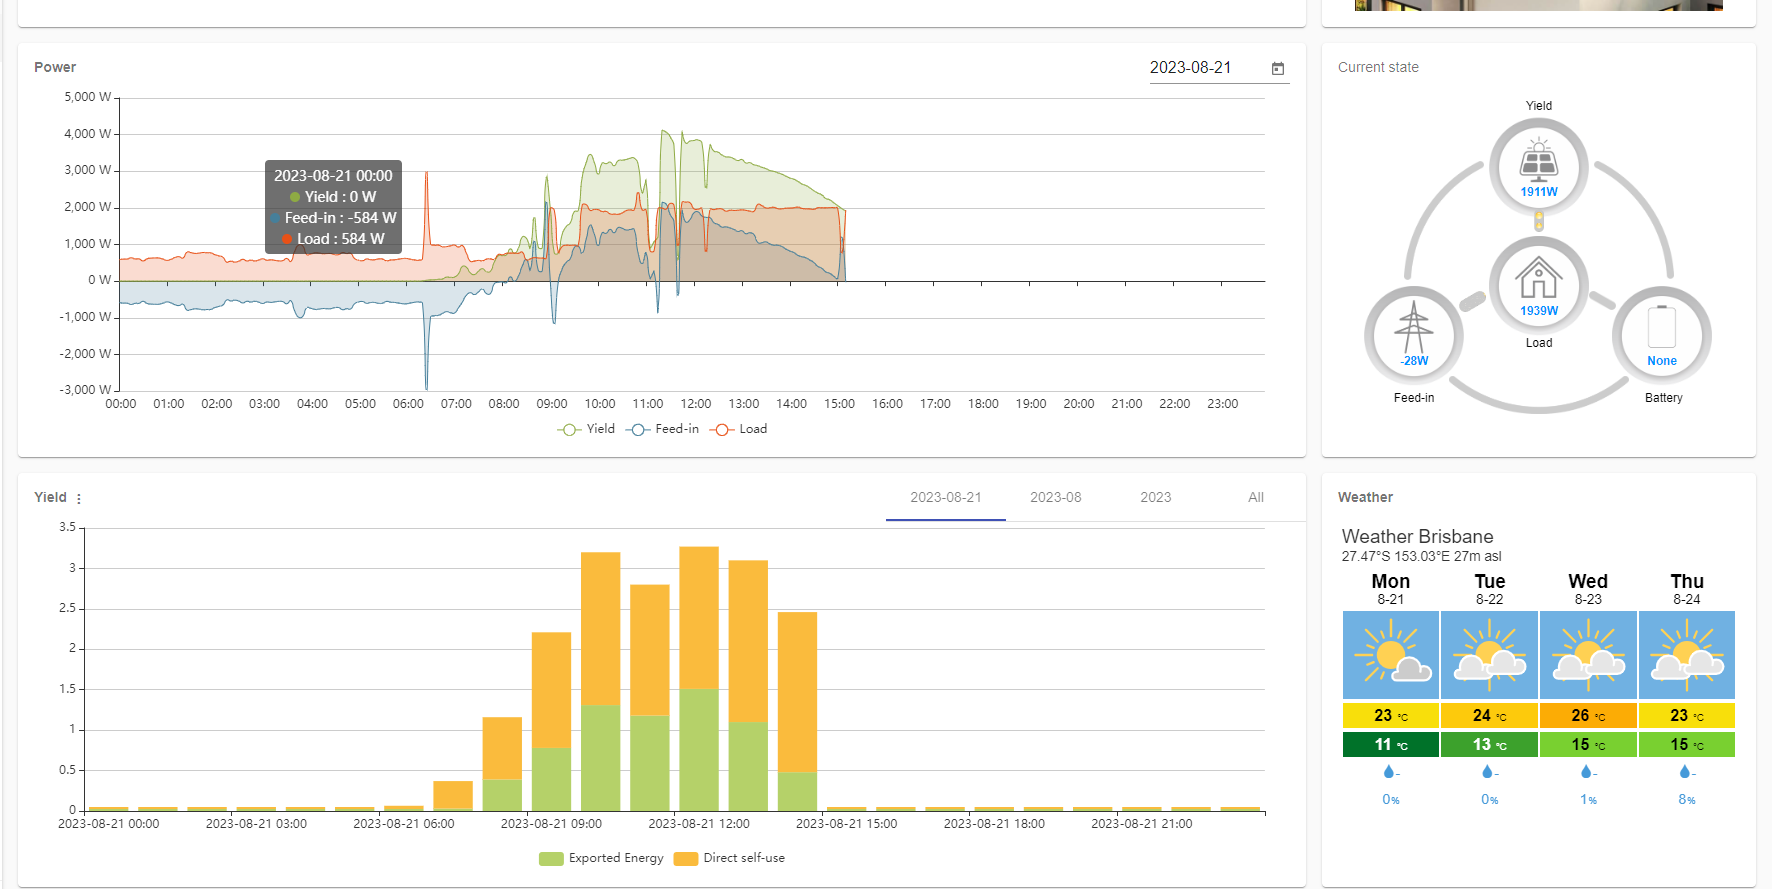
Docker Error log
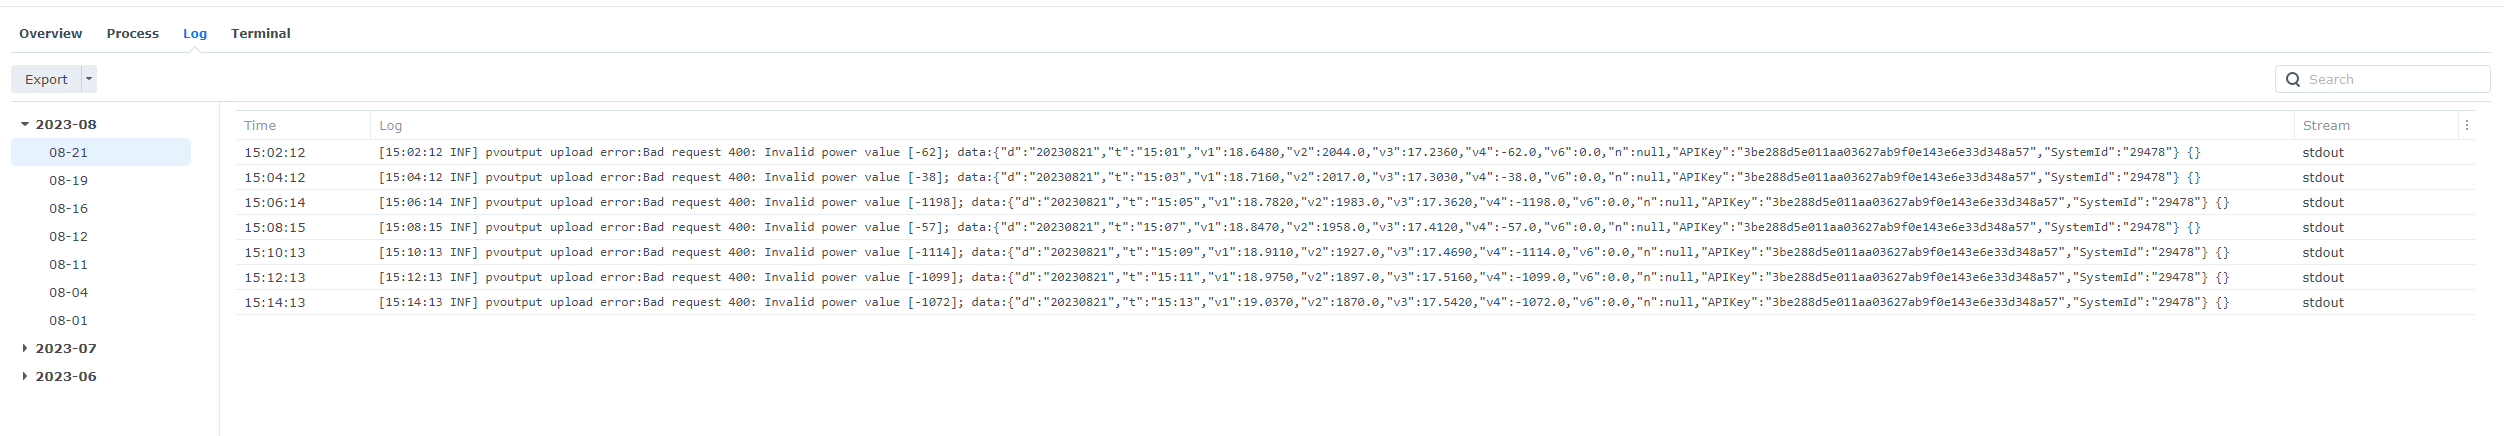
If I set the docker container IAMMeter settings as you suggested, how do I then get the PVOutput uploads working during generation hours where the output is a negative figure?
Please let me know.
1 whether you have change the meter type in IAMMETER-docker on Aug 3rd?
2 whether there are the same error log in Aug 3rd before Aug 3rd?
Hi,
No I had not changed anything in docker this month. I am not sure why we are talking about this?
These dates (Before the 3rd August) are where I have completely reloaded the data to PVOutput manually, to fix the rolling Energy Consumption data in PVOutput from IAMMeter.
Here is an updated one where I have reuploaded ALL dates prior to today to fix the Import (Energy Consumption) data. Highlighting the rolling import (Energy consumption)

From my second post, clarifying my opening post, highlighting everything I have previously advised.

"No, I had not changed anything in docker this month. I am not sure why we are talking about this?"
Hi:
These are the reason why I ask such questions
the meter type setting in IAMMETER-docker is wrong,(the meter type of grid is set to the load while the load is set to the grid).
There would be no correct result in this wrong setting obviously.
If there is not someone modifies the meter type setting in Docker manually, the meter type setting can not be changed automatically
(we have not received any feedback that the meter type would be changed abnormally after setting)
But as you said, the result before Aug 3rd is correct, which means the setting before Aug 3rd would be correct.
So I guess there would be some changes on Aug 3rd.
2 when you change the setting of meter type in IAMMETER-docker correctly, the result in IAMMETER-docker are all normal, but it reports error in the PVoutput log, so I want to check whether this error log always exist before Aug 3rd.
The result before the third is only correct because I manually fixed it.
This is what I am here for to try to get this all working right, forget 3 August that has nothing to do with this issue, it was used only as an example to demonstrate the issue, not a change to any configuration...
Great I get that the IAM Meter docker is set wrong, I did suggest this much earlier on, but when I have this set correctly then I do not get any uploads to PVOutput during generation due to negative figures, which I showed above excerpt from the docker logs straight after the change, showing the negative figures.
If there is a way in which I can fix this and have the docker container set correctly then I am all for this, and happy to make any clamp changes and the docker changes you advise and any other required changes to get this working.
Is this because we are using net metering? and docker container does not support?
This problem has nothing to do with the NEM metering.
Only because of some limitation that pvoutput.
we define the negative feed-in power as importing power from grid,it seems the PVouput do not accetpt the negative value ,it needs an extra paramter to define the direction of the poewr.
ALL meter-type settings and CT installation must be the same as our document, otherwise, it would calculate the wrong result in our system.
We do not have a special installation manual for PVoutput.
I already stressed before, the key to this problem is the negative power reading is not accepted by the PVoutput, this limitation has nothing to do with IAMMETER.
If the operation before Aug 3th can get the correct result, you can just follow the operation before Aug 3th.
So why provide a PVOutput integration?
Again you keep banging on about the 3rd, really? I really don't know how many times I need to say the same thing? These figures are ONLY correct because of manually fixing it.
If your integration used load and not grid to upload to PVOutput then it wouldn't be a problem, load will always be positive, and grid will be negative during generation hours
"Again you keep banging on about the 3rd, really? I really don't know how many times I need to say the same thing. These figures are ONLY correct because of manually fixing it."
Do you mean this below
You manually fix the data before Aug 3rd, so the pvoutput result is correct,
On Aug 3rd, you found the PVoutput integration in IAMMETER-docker, so you used it directly and did not fix and upload the data to PVoutput manually, then you found the problem in Pvoutput.
Yes?
YES - You manually fix the data before Aug 3rd, so the pvoutput result is correct.
I have manually subsequently fixed other dates manually by reuploading the data to PVOutput to fix these other dates as well, reference post 2023-08-23 13:12 (with pictures and highlighting as above) this was in an attempt to stop talking about changes on the 3rd August.
References of my manual intervention (and process) to correct the Energy Used figures on an ongoing basis (daily).
Opening post "The workaround which is annoying is to download all this information, then use the live loader to only load the power and generation used figures"
3rd August reference 2023-08-18 09:21 "All the ones below the line are correct where I have downloaded the data and uploaded just with any of the energy used or generation figures, this way PVOutput automatically calculated these correctly"
023-08-20 07:37 "I am downloading the data , and then using pvoutput live uploader to add power figures not the energy (cumulative total) figures, I let PVOutput automatically calculate these."
2023-08-23 13:12 "These dates (Before the 3rd August) are where I have completely reloaded the data to PVOutput manually, to fix the rolling Energy Consumption data in PVOutput from IAMMeter."
I think these are the reasons why we communicate so difficult
1 I am not very familiar with Pvoutput, so I did not realize there would be a way that upload the data manually. I am also not very sure which data are accepted by pvoutput and what is the limitation. So I did not understand the meaning of the sentences you stressed before.
2 I only focus on why the IAMMETER-docker and IAMMETER-cloud have different results. And after this problem is obvious(you swap the CT setting in docker to adapt the PVoutput requirements), I do not have enough interest to investigate the limitation of the pvoutput.
3 I do not understand why you use the wrong meter type setting IAMMETER-docker to adapt the PVoutput.This is obvious to introduce a new problem to solve an old problem.
I spent a lot of time to find out this problem. This is also the reason, why I do not have enough interest to continue later.
For your question ,
I have asked my colleague to upgrade the IAMMETER-docker to a new version(it has already done,you can upgrade to the latest),that do not upload any negative power value to pvoutput anymore (replace the negative by 0).
1. Ok fair enough - But why offer integration if there is no expertise to support it
2. All I care about is IAM Meter Cloud, Home Assistant and PVOutput (due to having so much historical information here), all are fine and are working with the one exception of this issue I raised for PVOutput energy used rolling figure.
3. If I don't have the clamps/settings this way in IAMMeter Docker I get no data to PVOutput, it is also correct in IAMMeter Cloud and Home Assistant so didn't really care if it displayed bad in IAM Meter docker, so long as it was working as expected in all three systems that I cared about, and it does in this configuration
I will try out the new IAMMeter docker, thanks for the update.
"1. Ok fair enough - But why offer integration if there is no expertise to support it"
This feature was integrated into the IAMMETER-docker nearly two years ago. We provide this feature just for fun.
At that time, we were very familiar with PVOUTPUT.
After two years, we have never been reported any feedback about PVOUTPUT in IAMMETER-docker(the image had been downloaded many thousands), which leads to two results.
1 We are not familiar with PVOUTPUT anymore.
2 It proves that very few customers use this feature, which leads us to have no interest in maintaining it anymore.
You are the first person that report the error log that the negative power would not be accepted by PVOUTPUT, so you may be the only person that used this feature since it had been supported.
Upgraded and tested, and yes it continues to upload now without negative figures, but anything negative is set to zero.
Now I can see that this is integration is not fit for purpose in this configuration.
The reason I use PVOutput is that I have historical power and weather data going all the way back to 2014, and it has some very powerful statistical calculations.
I believe all that needs to happen to resolve the issue is to flip the grid feeding to PVOutput with the Load value, because you want the actual consumption value not what the grid is doing all of this is auto calculated.