There is a bad description, there is average energy in the graph, and in the description in the box there is total energy.
Additional question, is it possible that there is nenegia total on the chart? Is possible the sum of the energy of days 1 + 2 + 3 ..., for individual hours, like now for the average?
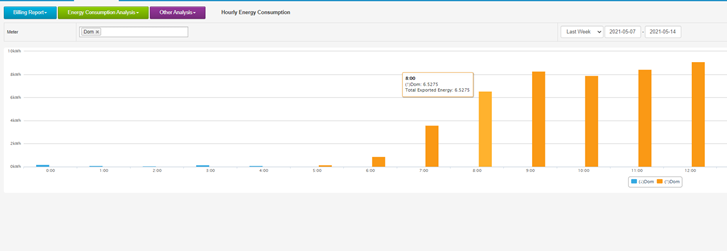

yes, it is not accurate description here ,we will change it next week, thanks for your feedback.
Hi,
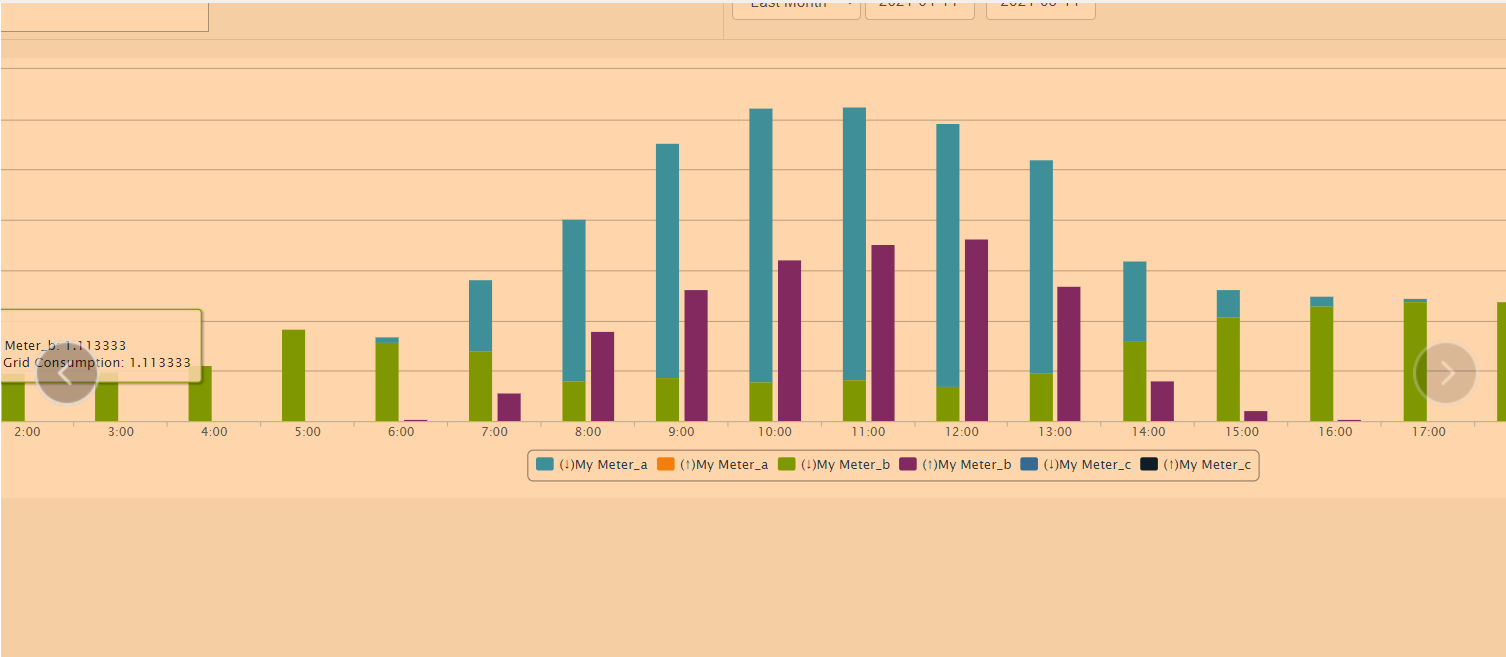
I have just ask to my colleague about this question, he told me that this is indeed the average result, but the "total" mean you can choose more than one phase ,and the graph will add all phase kwh data firstly(total) , then do the average .
You may be right, but there is not a single mention anywhere on the entire page.
The second topic is that no one needs such accuracy (6 decimal places)